Is $1840 the next target for Ethereum bulls?

Disclaimer: The information presented does not constitute financial, investment, trading, or other types of advice and is solely the writer’s opinion.
- The H4 and 1-day market structures were at odds with one another.
- The evidence showed that buyers had an advantage in the lower timeframes.
The number of new Ethereum addresses staking ETH had been rising, and the amount of ETH staked has increased since April. This trend began to shift after the first week of June, likely over regulatory concerns after the SEC filed a lawsuit against Coinbase.
Is your portfolio green? Check the Ethereum Profit Calculator
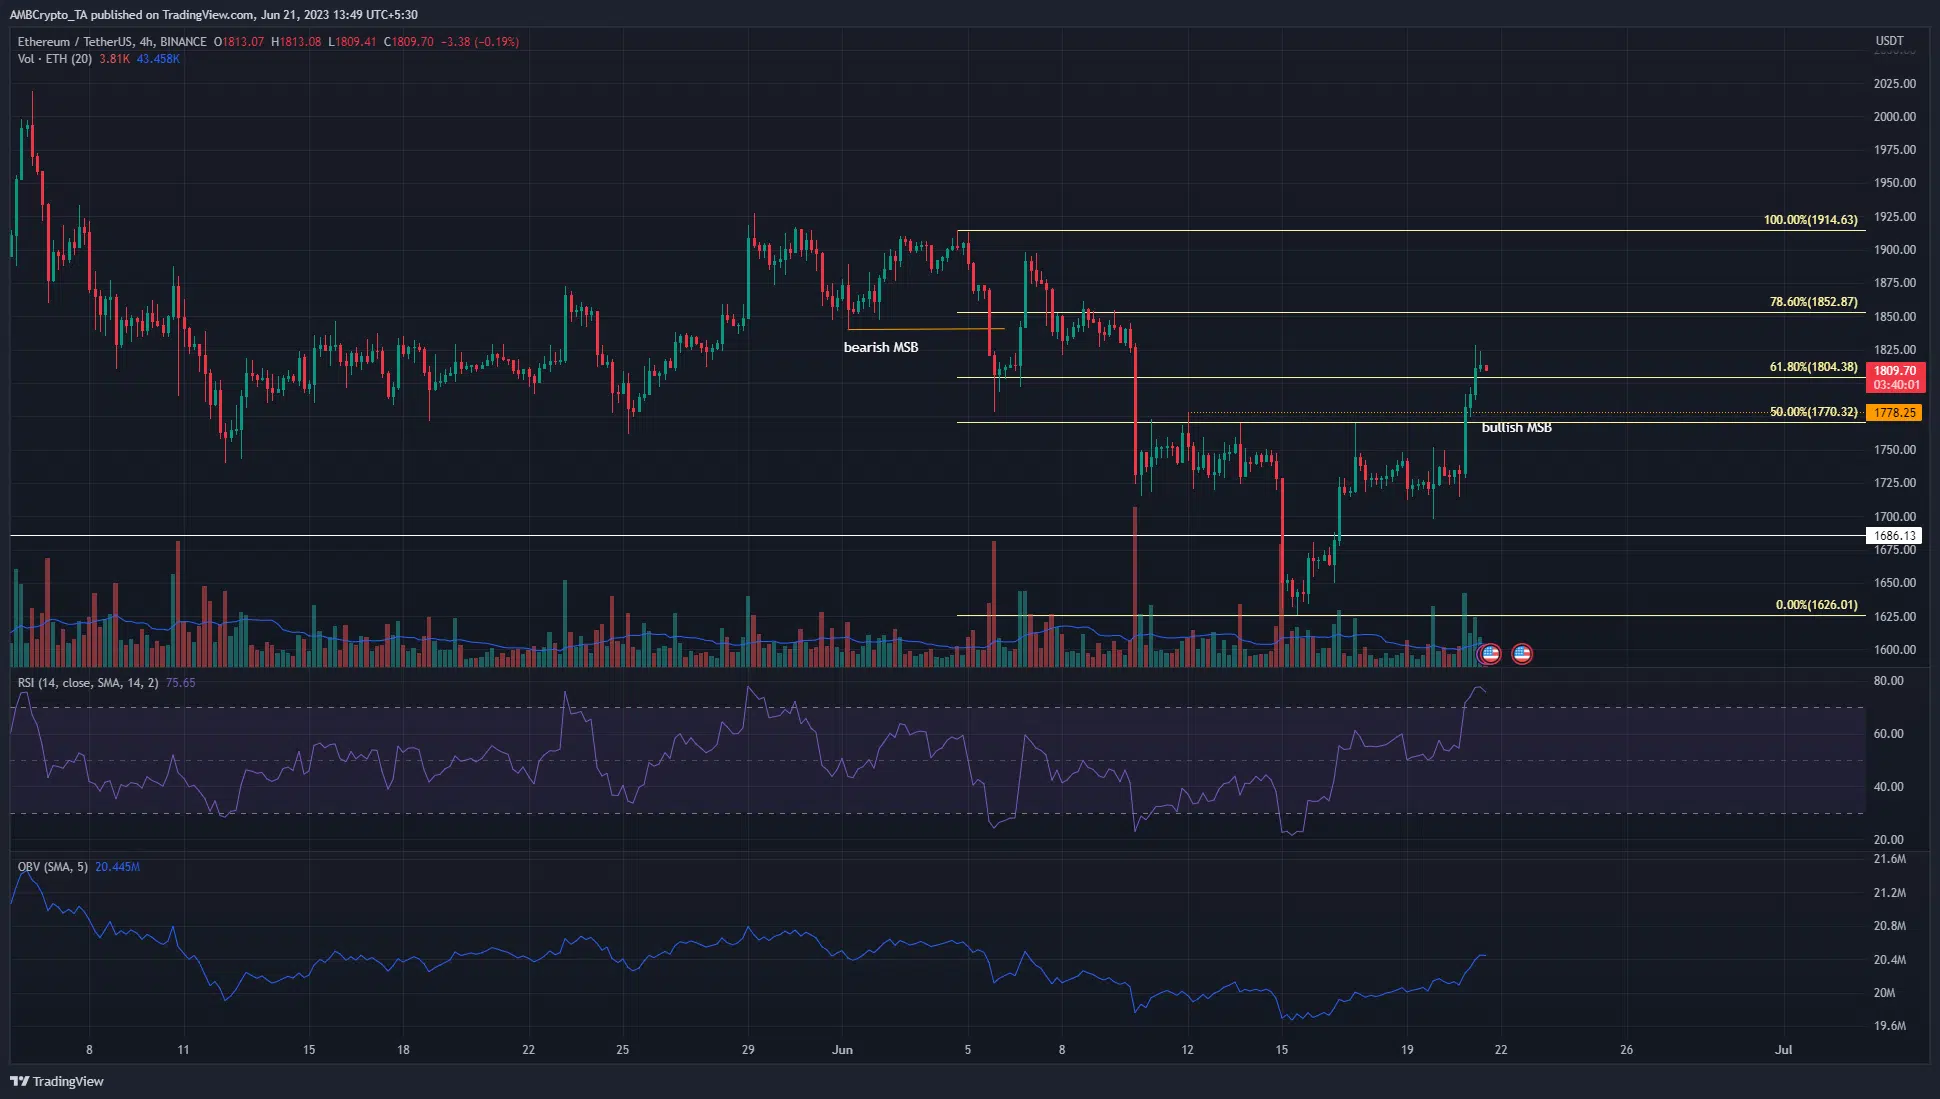
Despite the bearish news developments earlier this month, the price action of ETH took a bullish turn on the H4 chart. The move above the recent lower high at $1778 signaled a shift of power toward the buyers.
Can traders expect a rally after the breach of the $1800 resistance?
The H4 market structure was bullish after the $1778 level was breached. This move represented a bullish market structure break but the trend was not yet in favor of the buyers. ETH bulls must post a higher low and higher high- but we haven’t yet seen even a pullback after the MSB.
The RSI was in the overbought territory to show strong bullish momentum, while the OBV has managed to undo some of the losses of the past two weeks. Yet, although the H4 chart showed signs of bullishness, the daily timeframe presented evidence to the contrary.
The move below $1785 back in mid-May showed that the higher timeframe bias was turning bearish. The recent drop below $1686 (white) indicated that Ethereum was beginning to trend downward on the daily chart. To invalidate this idea, Ethereum must climb past $1914. The Fibonacci retracement levels showed that $1804 and $1852 can also be important levels where a reversal or continuation can occur.
The $1840 region has been significant in the past two months, therefore an ETH surge above the $1852 mark would be a sign of strong bullishness. At the time of writing, caution was warranted, but the chart showed that the buyers had the upper hand.
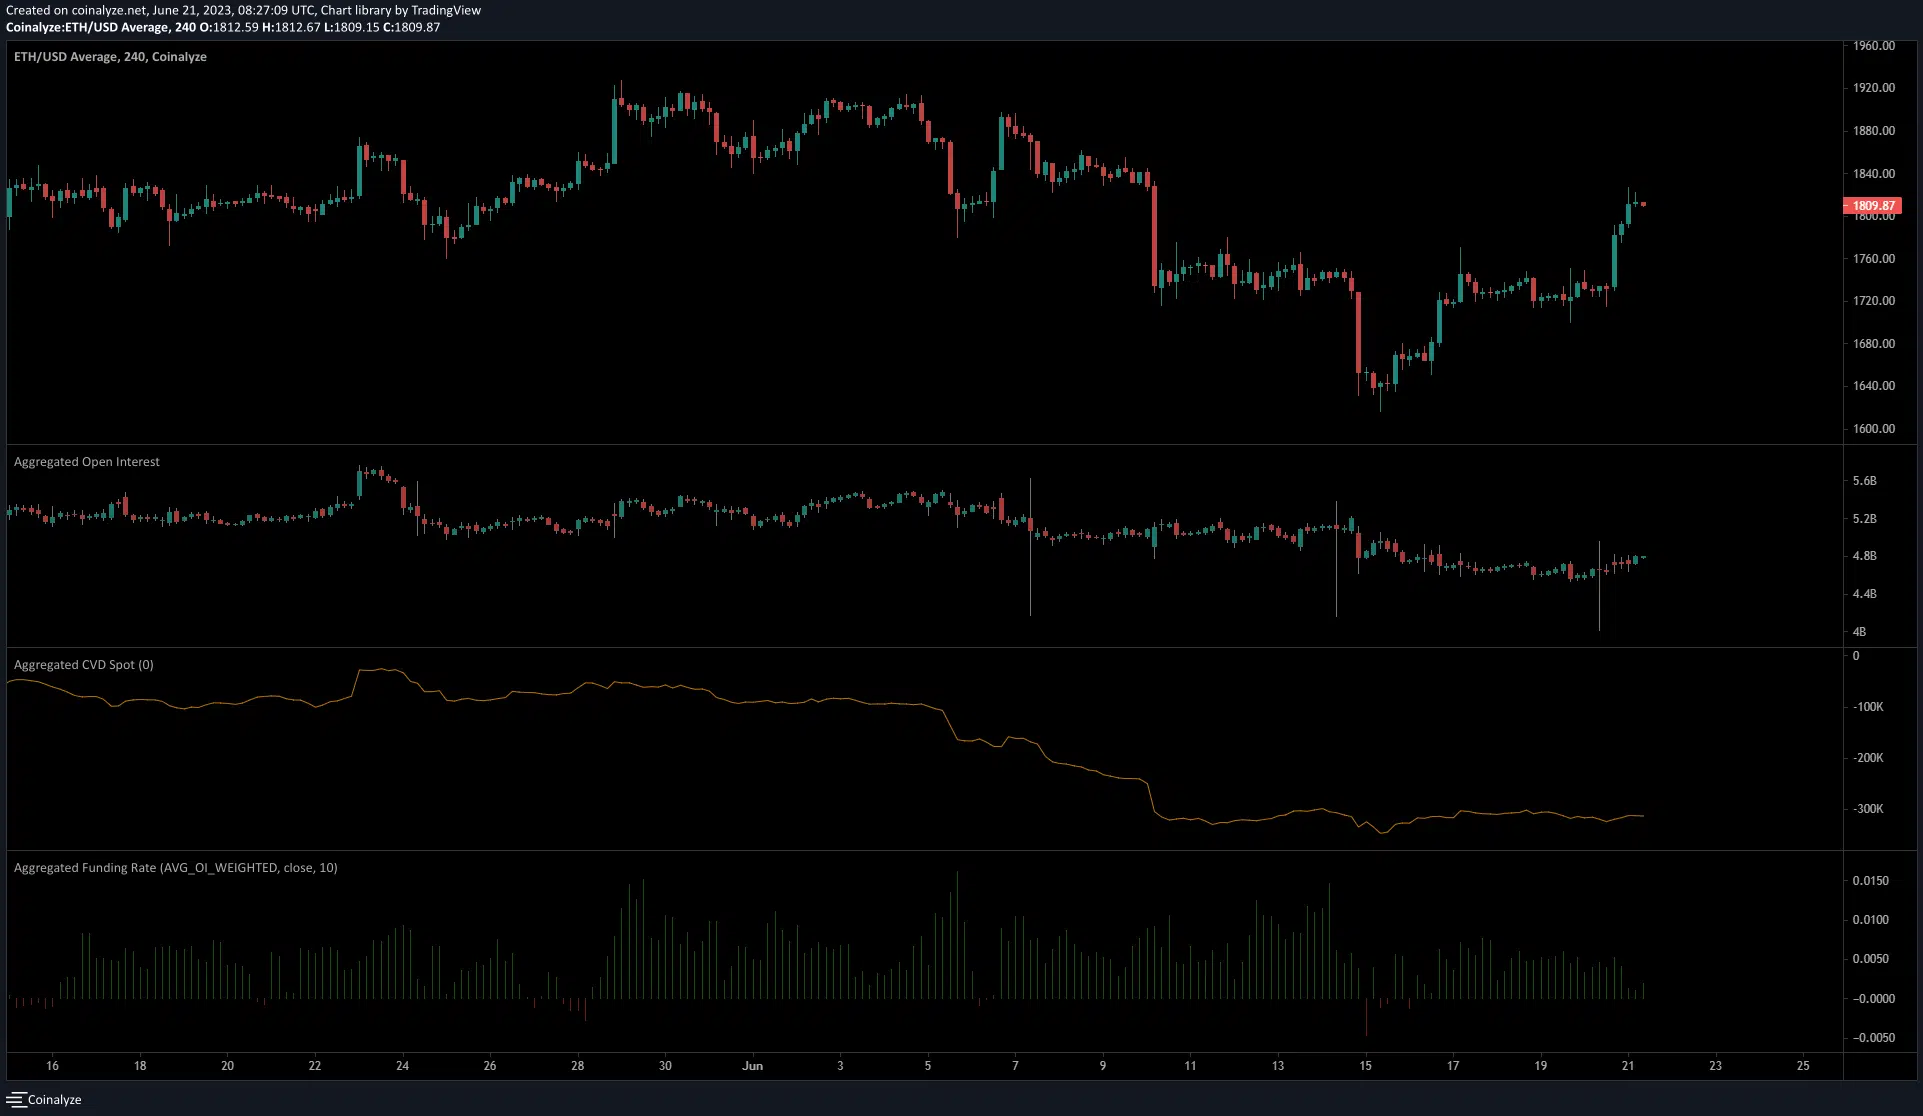
The Open Interest continued to trend downward despite recent price gains

Source: Coinalyze
The spot CVD has begun to gradually ascend higher since 11 June, but these gains were tiny in comparison to the drop in early June. More worryingly for the bulls, the Open Interest did not see a strong rally despite rising prices.
How much are 1, 10, or 100 ETH worth today?
This showed sidelined speculators and discouraged longs, and indicated that sentiment was not bullish yet. Therefore, traders can wait for a move above $1850 or below $1770 to re-asses whether the market presented a trading opportunity.


