Is AMP crypto’s rally at risk? Signs of reversal emerge after 11% gain
AMP has formed an ascending channel with higher highs and lower lows since 5th August.

- AMP price has gained by 11% in the last seven days, with the token hitting fresh monthly highs.
- However, the RSI is hinting at a possible reversal as the buying pressure eases.
Amp [AMP] crypto price was up 11% in the last seven days and was trading at $0.0043, at the time of writing according to CoinMarketCap. The altcoin has faced intense volatility in the last 24 hours, with the price oscillating between $0.0042 and $0.0047.
AMP price was down by 4% at the time of writing, with the downtrend likely coming from sellers taking profits after the recent rally.
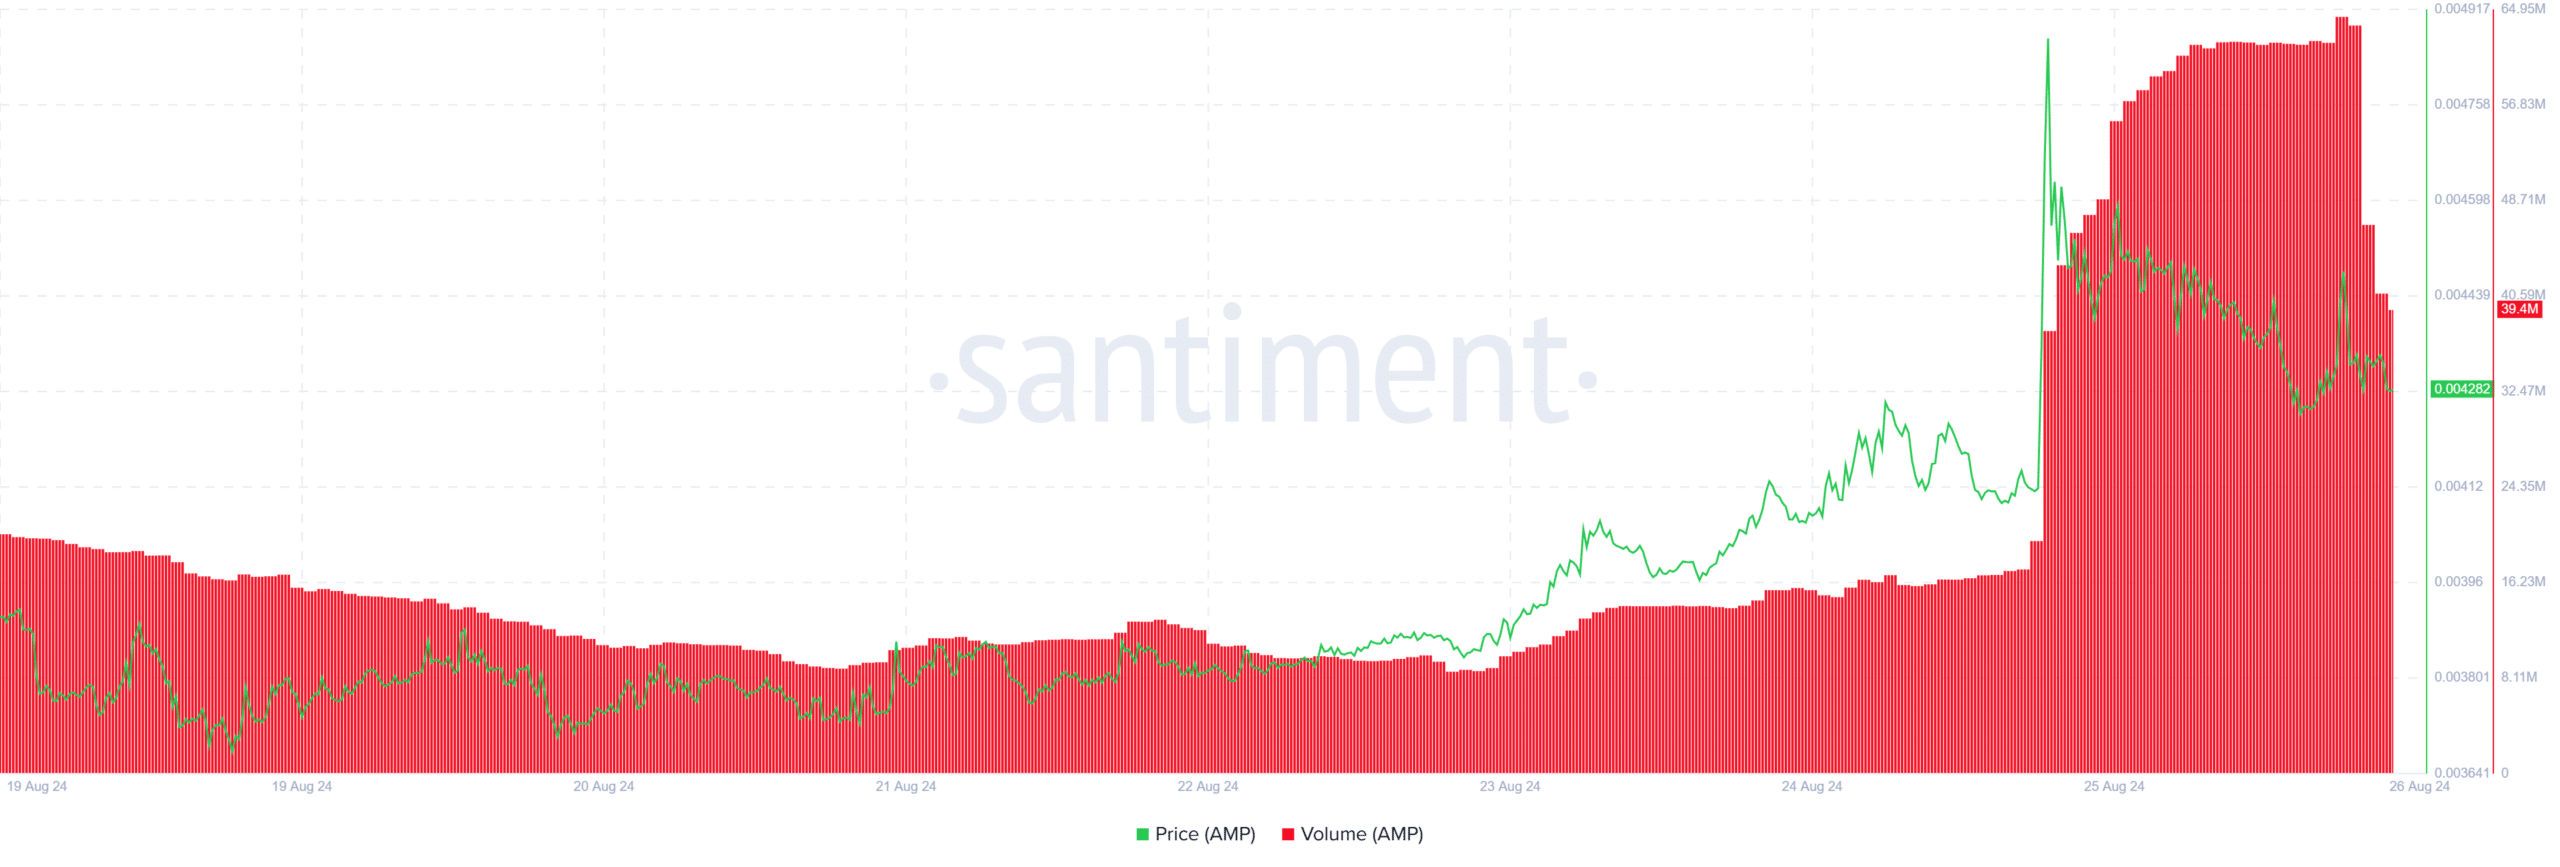
Data from Santiment shows that after the price hit a monthly high above $0.0047, it was accompanied by a surge in trading volumes. These high volumes likely came from sellers who caused the price to drop shortly after.
With AMP still sitting on substantial weekly profits, will the uptrend resume, or will the downtrend persist?
AMP crypto hints at reversal ahead
The AMP crypto price has formed an ascending channel with higher highs and higher lows since 5th August. This pattern is often bullish as it shows a steady and gradual uptrend.
However, for the uptrend to be sustained, AMP needs to breach the upper trendline of the ascending channel.
A look at the four-hour chart shows that AMP crypto price is below the middle of the channel and is approaching the lower trendline. If it breaks below, the downtrend will persist, paving the way for further dips.
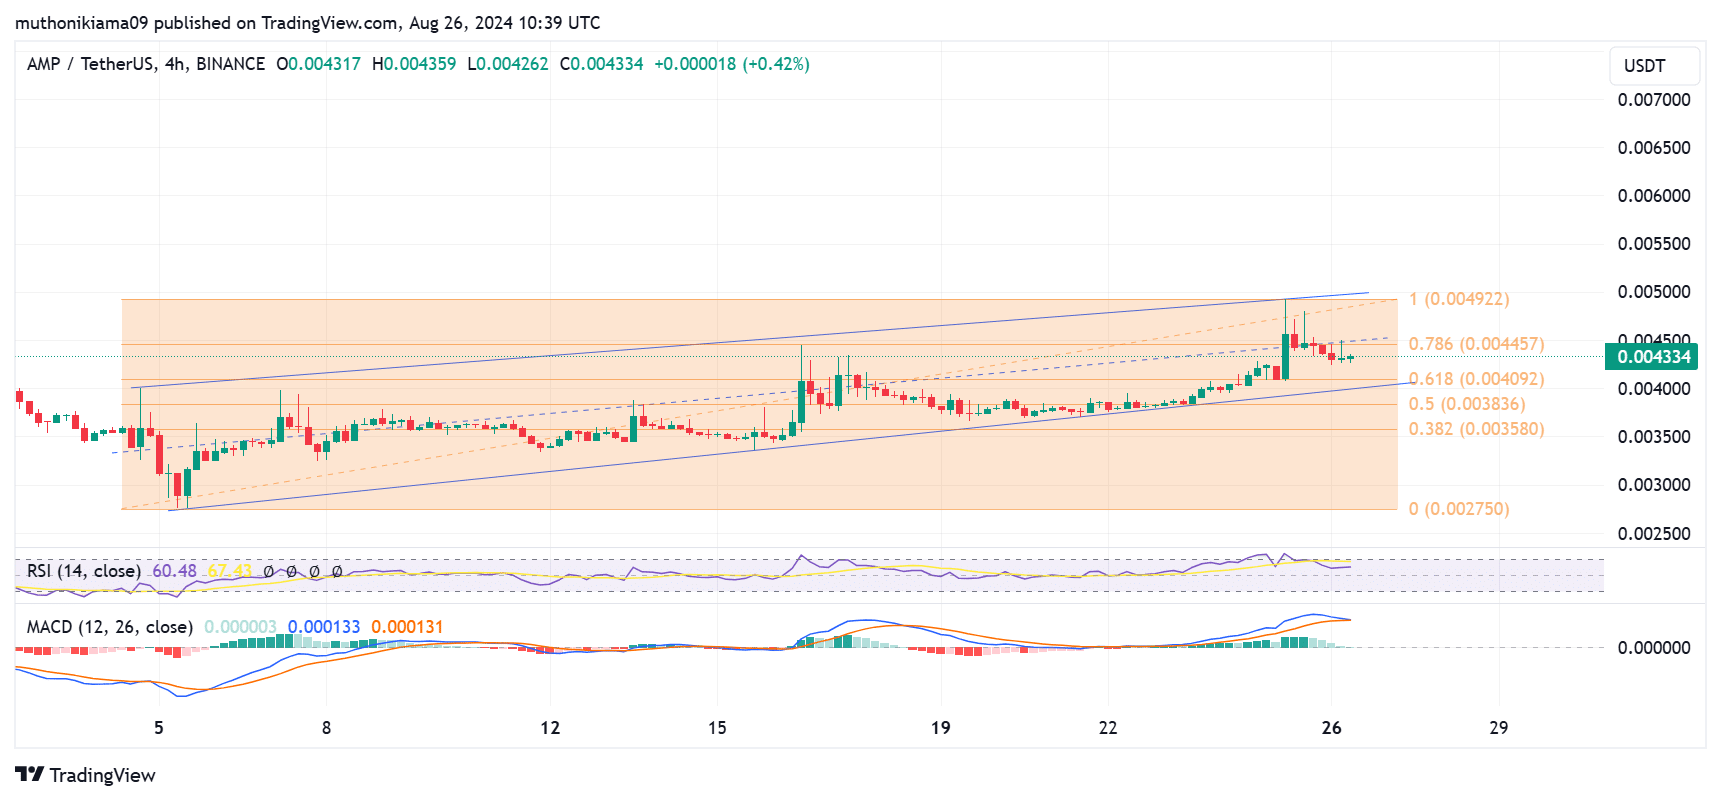
The Relative Strength Index (RSI) at 60 suggests buying activity. However the RSI has reversed from the near overbought region, and it is currently trending lower. This hints at potential signs of reversal within the ascending channel.
Another possible bearish crossover is seen in the Moving Average Convergence Divergence (MACD) line. This trend line is converging with the signal line, showing a possible change in the bullish momentum.
If bears grow stronger, AMP will drop to test a key support level at the 0.618 Fibonacci ($0.0040). On the other hand, a resumption of buying activity from traders looking to secure profits could see the 100% Fib level at $0.0049 retested.
Testing and breaking out of this resistance, which is also the upper trendline of the ascending channel, will confirm the bullish thesis.
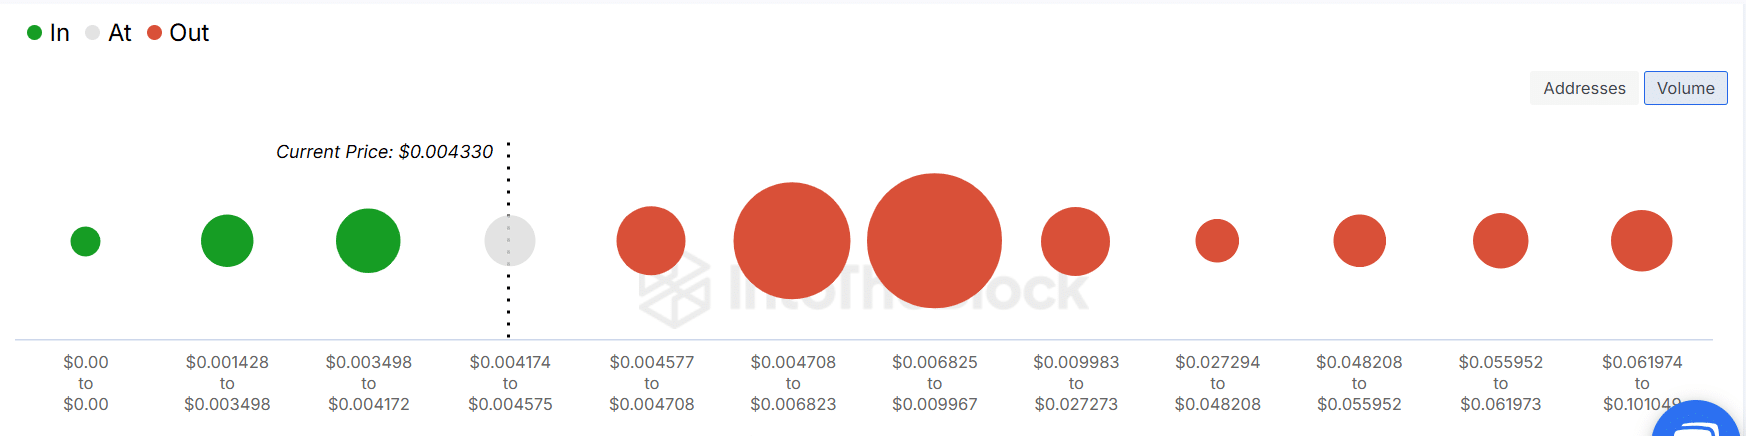
Data from IntoTheBlock shows that 82% of AMP holders are sitting in losses. Additionally, 1.6 billion AMP tokens are held at a break-even price between $0.0041-$0.0045.
Therefore, an AMP crypto rally might be met with selling activity as traders seek to mitigate losses.