


Bitcoin price has formed a base around a vital support level, indicating that an uptrend is likely. The recent uptick is just the surface and more is yet to come for BTC.
Bitcoin price is on the verge to retest $50,000?
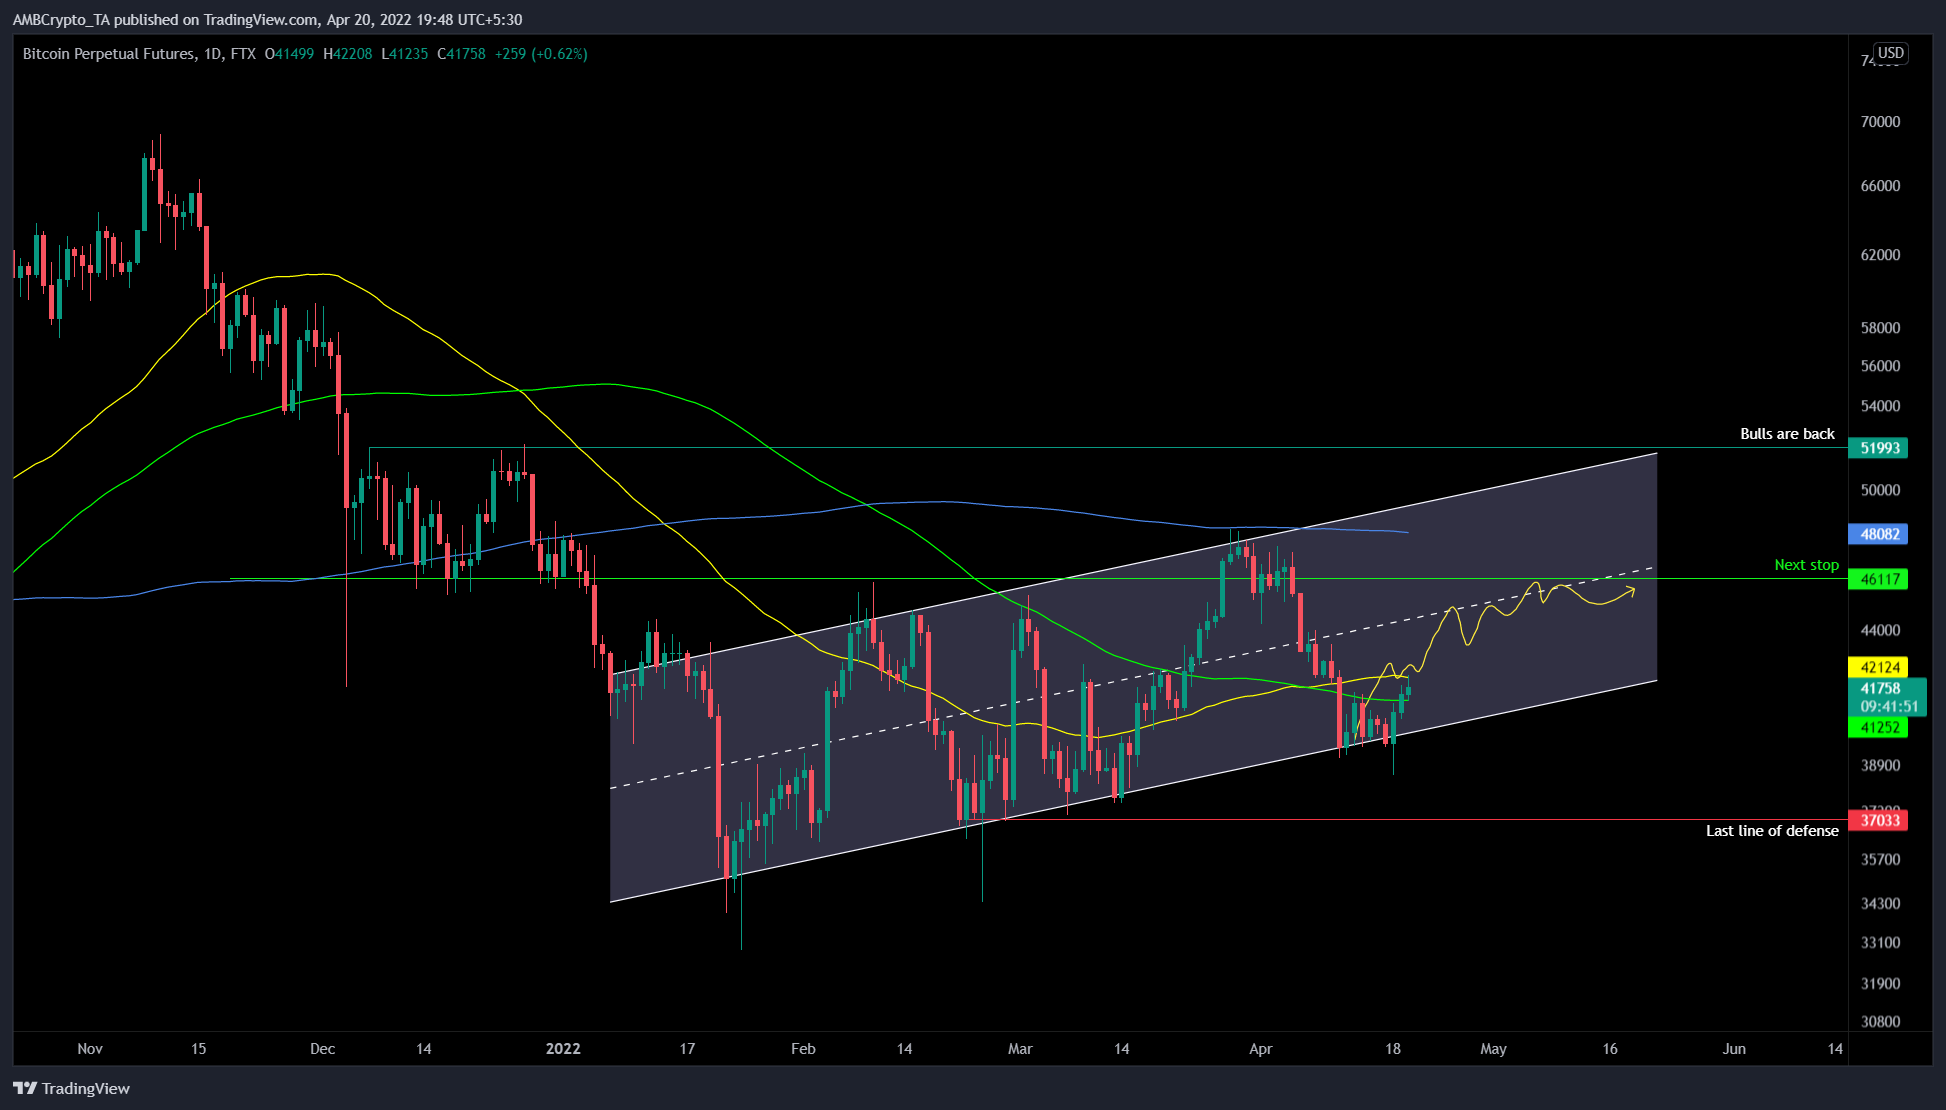
Bitcoin price action from 22 January to 20 April has set up four higher highs and three higher lows, indicating that the bullish momentum persists. Connecting these swing points using trend lines reveals an ascending parallel channel.
Although this setup has a bearish outlook after the breakout, BTC’s current position suggests that a retest of the upper trend line is plausible. The most recent crash on 28 March pushed it from $47,600 to $39,650. Interestingly, the big crypto formed a base along the lower trend line of the ascending parallel channel.
After a brief period of consolidation 10% to where it currently trades – $41,565. This run-up has pushed BTC above the 50-day Simple Moving Average (SMA) at $41,250 and is currently grappling with the 100-day SMA at $42,120.
A quick surge in buying pressure that pushes BTC above these two hurdles will propel it to $46,117, the next resistance barrier. The buyers’ conviction will be tested here and flipping this level into a support floor will indicate that the bulls are in control. In such a case, Bitcoin price will make a run toward the 200-day SMA at $48,081.
There is a good chance BTC will form a local top here, but sometimes, BTC could wick up and retest the $50,000 psychological level.
A macro bullish outlook will kick-start if Bitcoin price produces a weekly candlestick close above $52,000. In such a case, investors could wait for a higher low to form, which will serve as a secondary confirmation before BTC explodes to a new all-time high at $80,000.
The 30-day Market Value to Realized Value (MVRV) model reveals a perfect point for trend reversal. The index is used to assess the average profit/loss of investors who purchased MATIC tokens over the past month.
Santiment’s backtests have shown that a value below -10% indicates that short-term holders are selling at a loss and is typically where long-term holders tend to accumulate. Therefore, a value below -10% is often referred to as an “opportunity zone,” since the risk of a sell-off is less.
This indicator is currently hovering around -7% after a small recovery from -10%. As seen in the chart, the historical data shows that a local bottom has formed around -6.5% since February.
Therefore, the recent recovery indicates that BTC is serious about the uptrend and coincides with the outlook obtained from a technical perspective.
