Is Bitcoin’s low in? 3 signals will decide what’s next for BTC
Forced deleveraging has tended to mark local market bottoms, and the recent OI wipeout could be the third of the year to result in a sizeable bounce.



A week ago, Bitcoin [BTC] prices were hovering around the $75k level. The $73k level had been underlined as a key short-term support that the bulls had to defend. They failed to mount any kind of fight.
BTC plunged 17.7% from $75,368 to $62,006 in five days. On Sunday, the price bounced back to $65k, but it is unclear if the low is in.
Bitcoin crashes through paper support
AMBCrypto had previously warned that the $74k-$64k area was a thinly traded pocket that the price could fall through. With $2.93 billion in long liquidations on just the 13th and 14th of November, the market sentiment is heavily bearish.
Since the 5th of Thursday, every day of trading for Bitcoin spot ETFs has seen net negative flows. Cumulative since then, the ETF flows measured $1.907 billion.
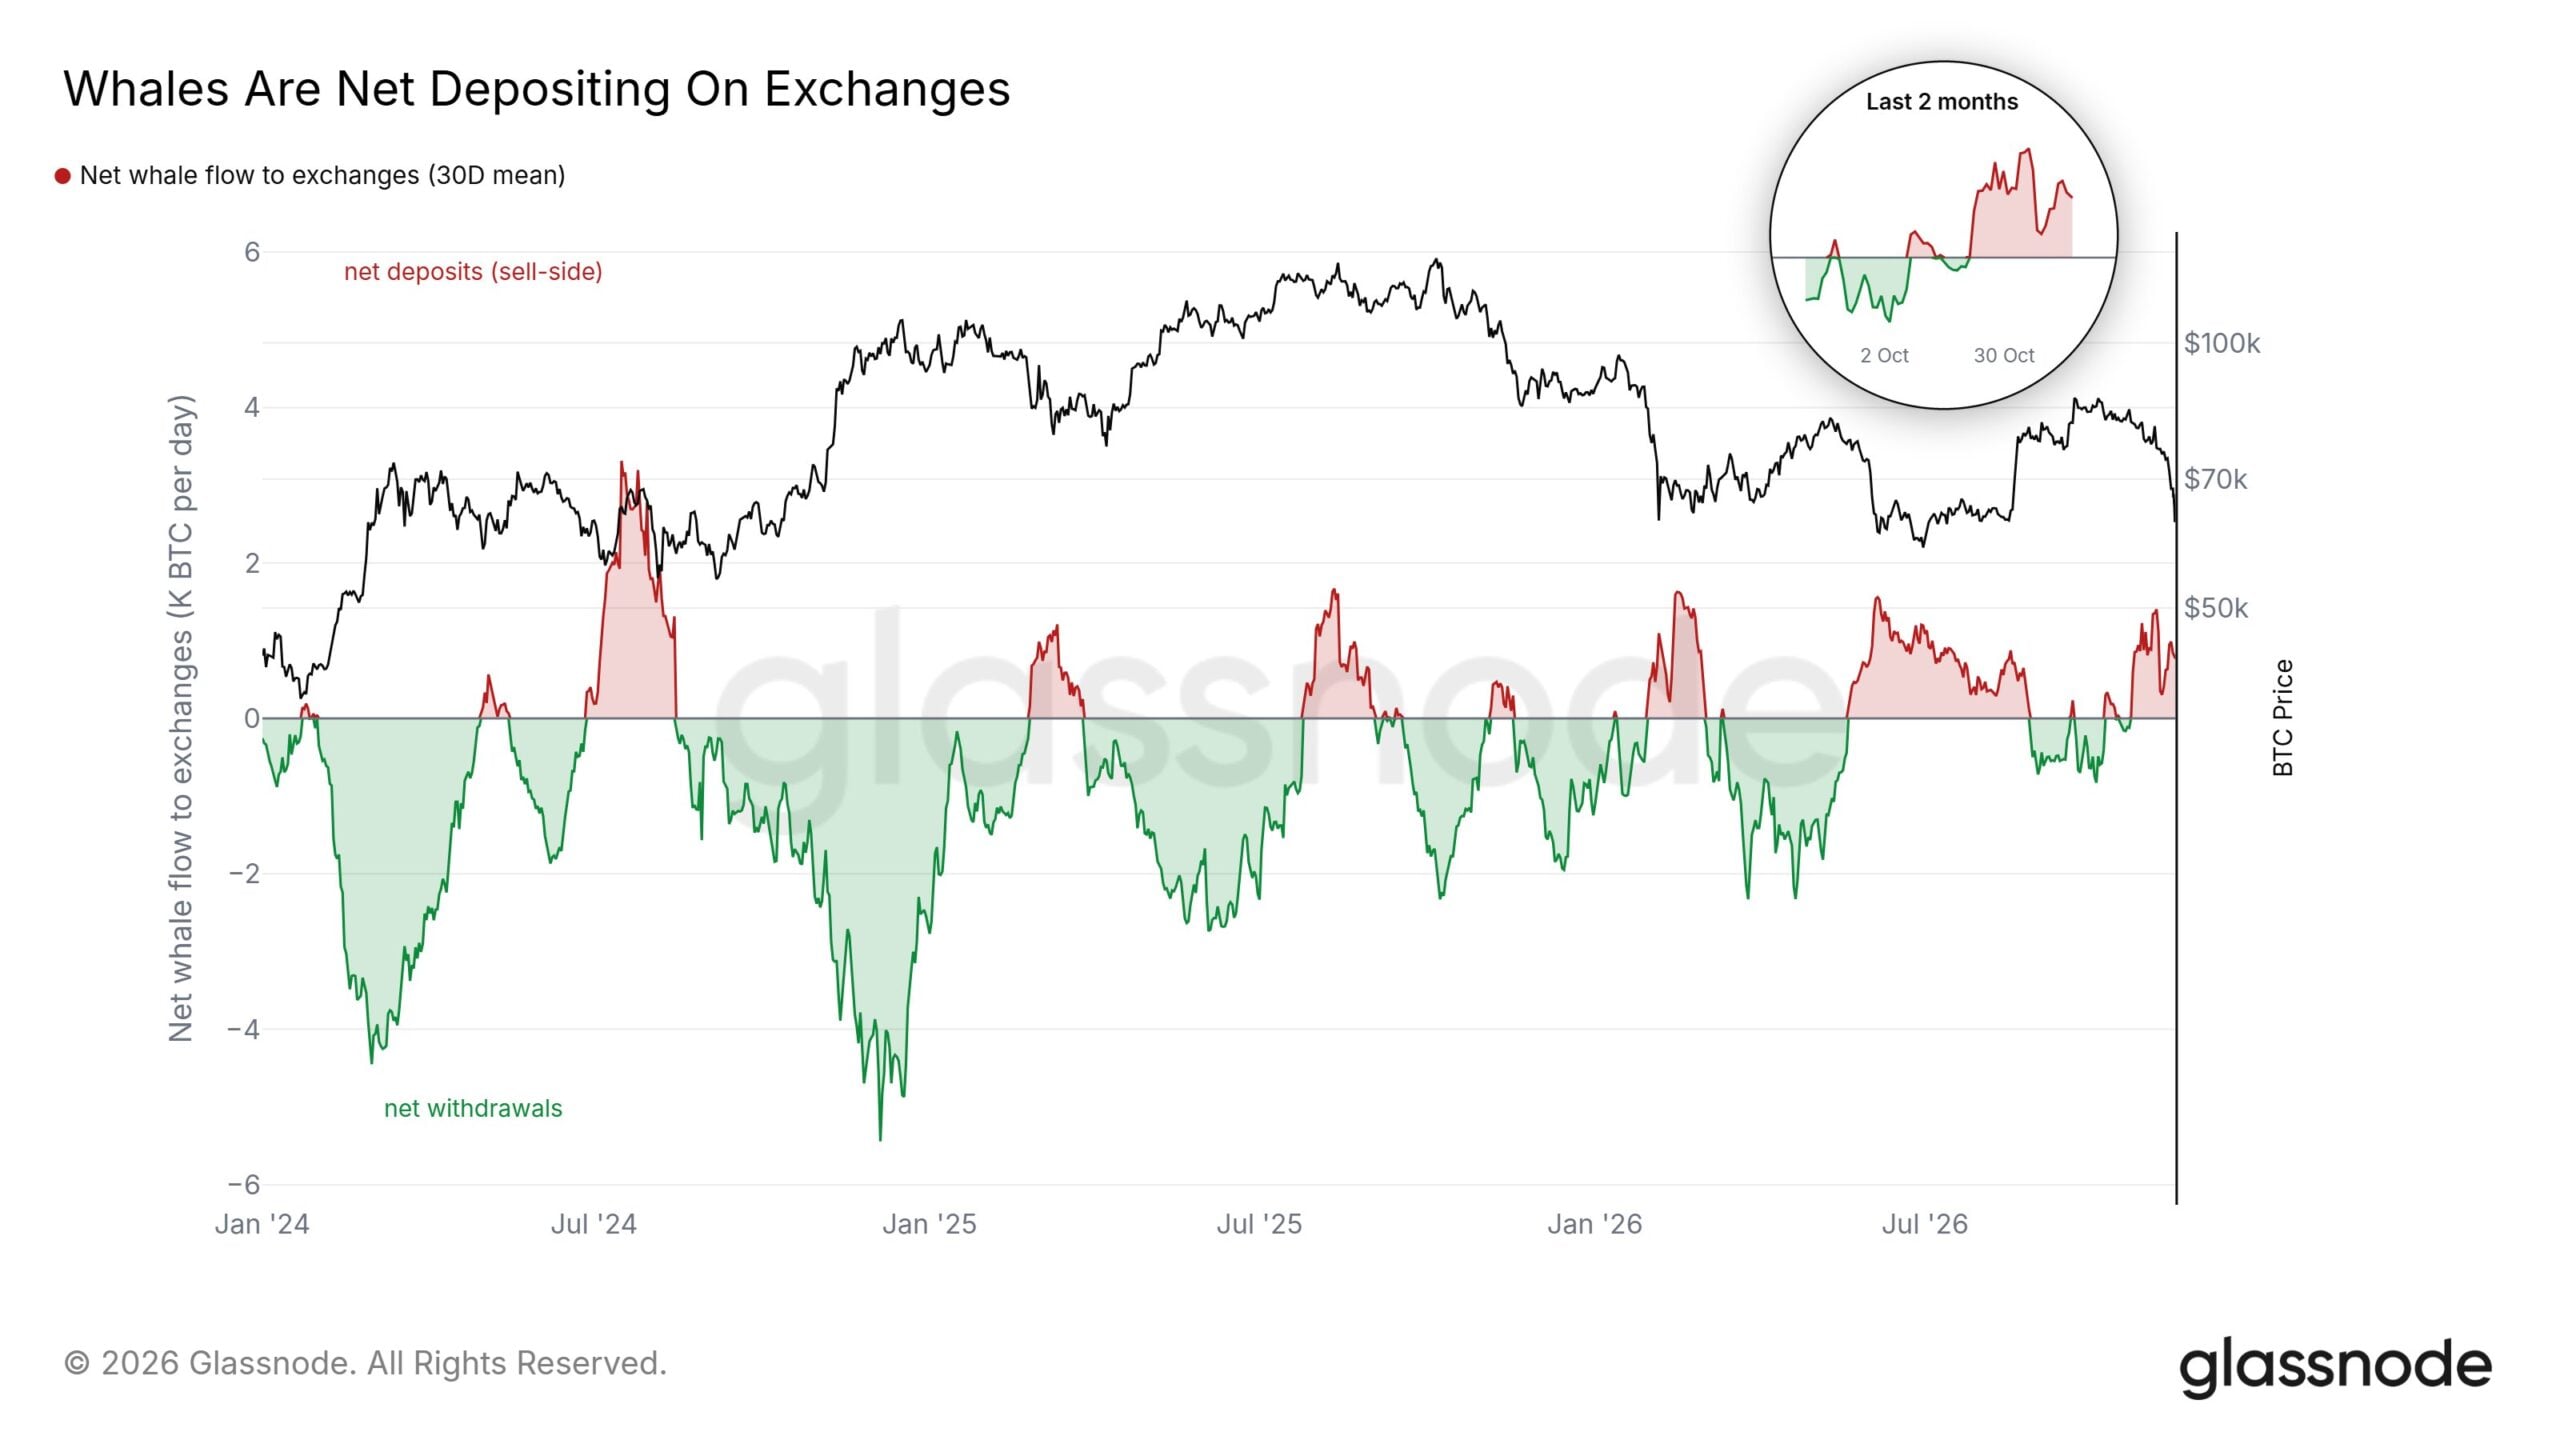
Whale sell pressure has been building on exchanges for weeks, according to crypto intelligence platform Glassnode. In a post on X, Glassnode used the 30-day average net whale flow to exchanges to demonstrate that whale deposits were higher than withdrawals by $55 million a day.
This trend has to shift toward withdrawals to signal easing pressure.
Futures leverage flush to mark the bottom of the current Bitcoin decline
There have been three major price declines for BTC in 2026. In February, the price drop from $87k to $67k was accompanied by an Open Interest decline from $9B to $5.5B, and the bottom had formed at this time.
In June, when the price reached a low of $59k, OI fell from $8B to $6.1B in a day, marking a flush and a local bottom.
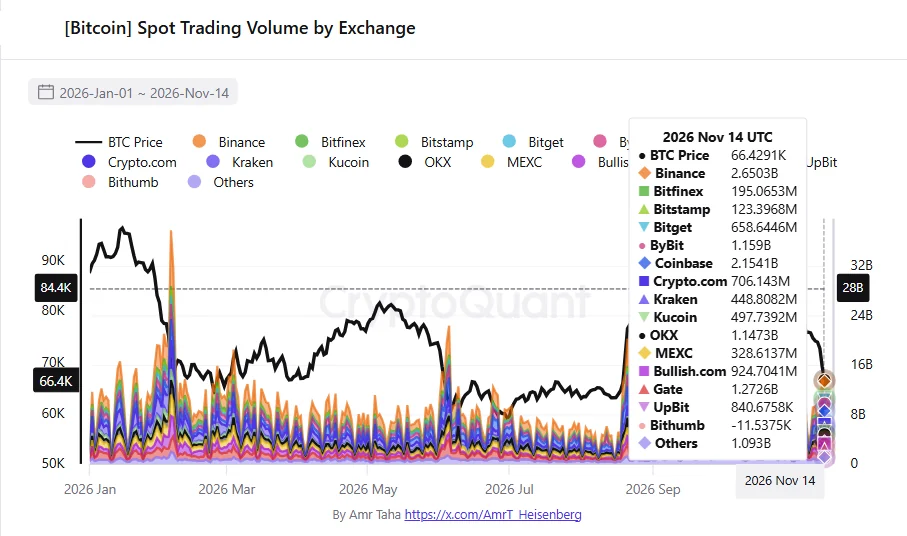
The Open Interest decline was significant. At the same time, it was worth exploring the dominance of derivatives trading volume across popular exchanges.
During the sell-off, Bitcoin Futures trading volume on Binance was $24.46B, compared to a spot trading volume of just $2.65B.
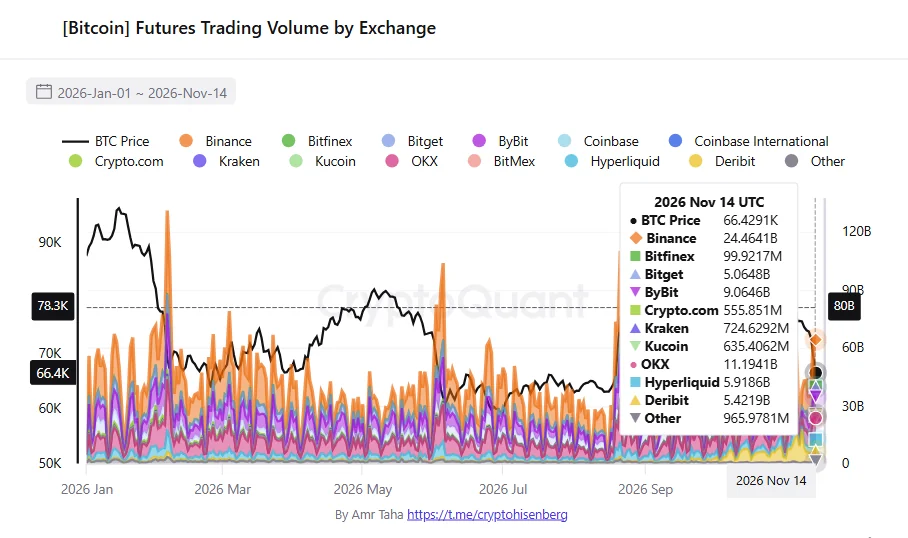
The roughly ninefold volume difference in Spot and derivatives products was seen on other popular exchanges, such as Bybit and OKX, too.
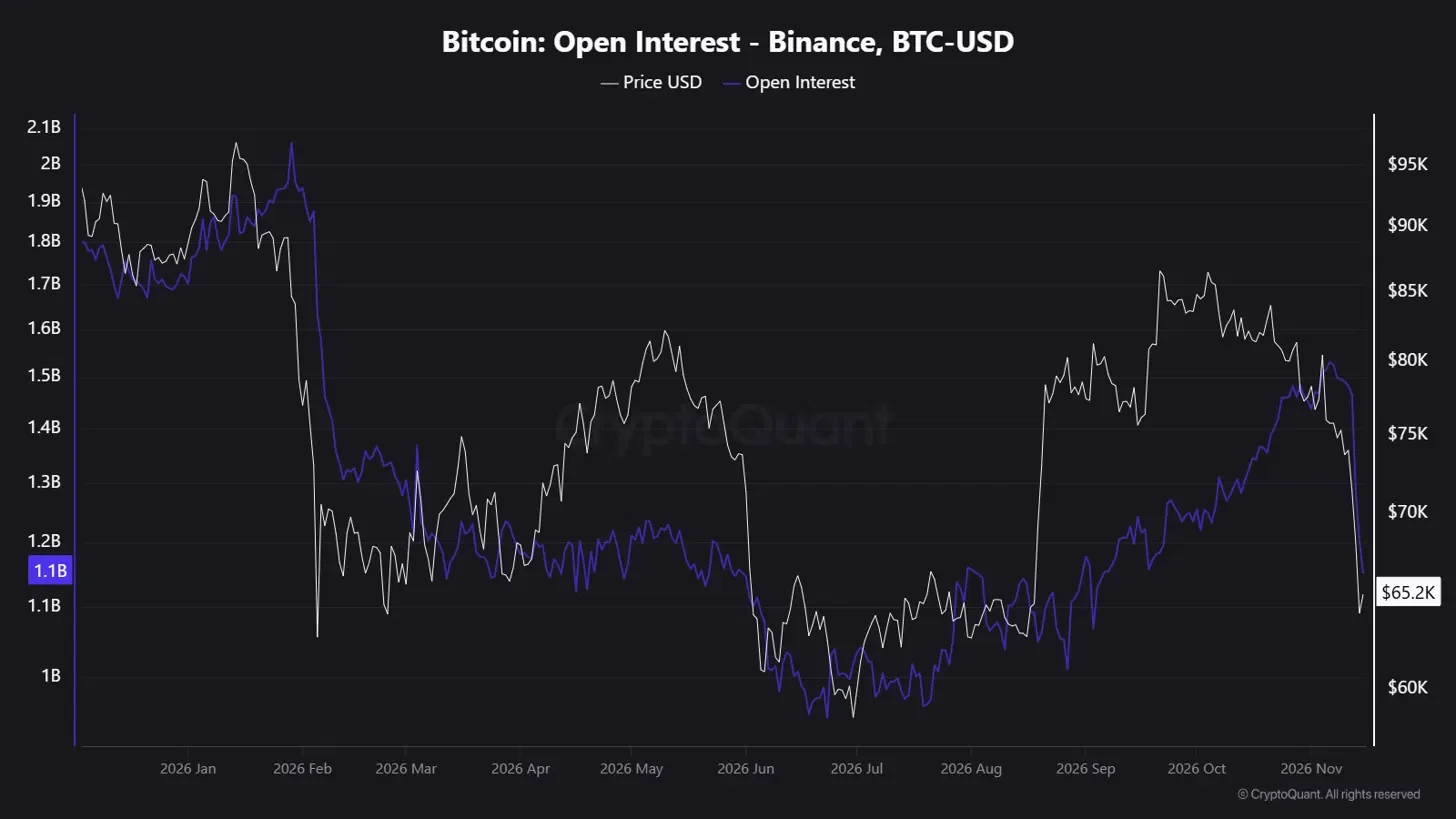
The October-November decline saw OI drop from $1.55B to $1.1B. Forced deleveraging has produced a market bottom earlier this year, concluded a crypto analyst on CryptoQuant, and similar deleveraging could mark the current bottom too.
Final Summary
- The $64k floor has been tested after a wave of intense selling and heavy liquidations.
- Forced deleveraging has tended to mark local market bottoms. The heavy OI decline recently was an early sign of a leverage flush and a potential local bottom.