Is Solana [SOL] headed toward $33? Technical tools indicate…
![Is Solana [SOL] headed toward $33? Technical tools indicate...](https://ambcrypto.com/wp-content/uploads/2023/01/PP-1-SOL-cover-3-e1674369111458.jpg)
Disclaimer: The information presented does not constitute financial, investment, trading, or other types of advice and is solely the writer’s opinion.
- The market structure remained bullish, and pullbacks were shallow
- A surge above $25.3 would underline the likelihood of a move to $28.7 and higher
In November and December, Solana registered large losses on the price charts. The drawdown in those two months measured 77% from $39 in early November to $8.62 in late December. In the past three weeks, Solana mounted a surprising comeback.
How much are 1,10,100 SOLs worth today?
A recent report highlighted how Solana suffered a drop in important metrics alongside the prices in Q4 2022. 2023 brought a shift, though; daily active addresses are up by 47%. Technical analysis showed further upside was likely.
Solana’s Fibonacci retracement levels show large gains can follow a breakout past $25.58
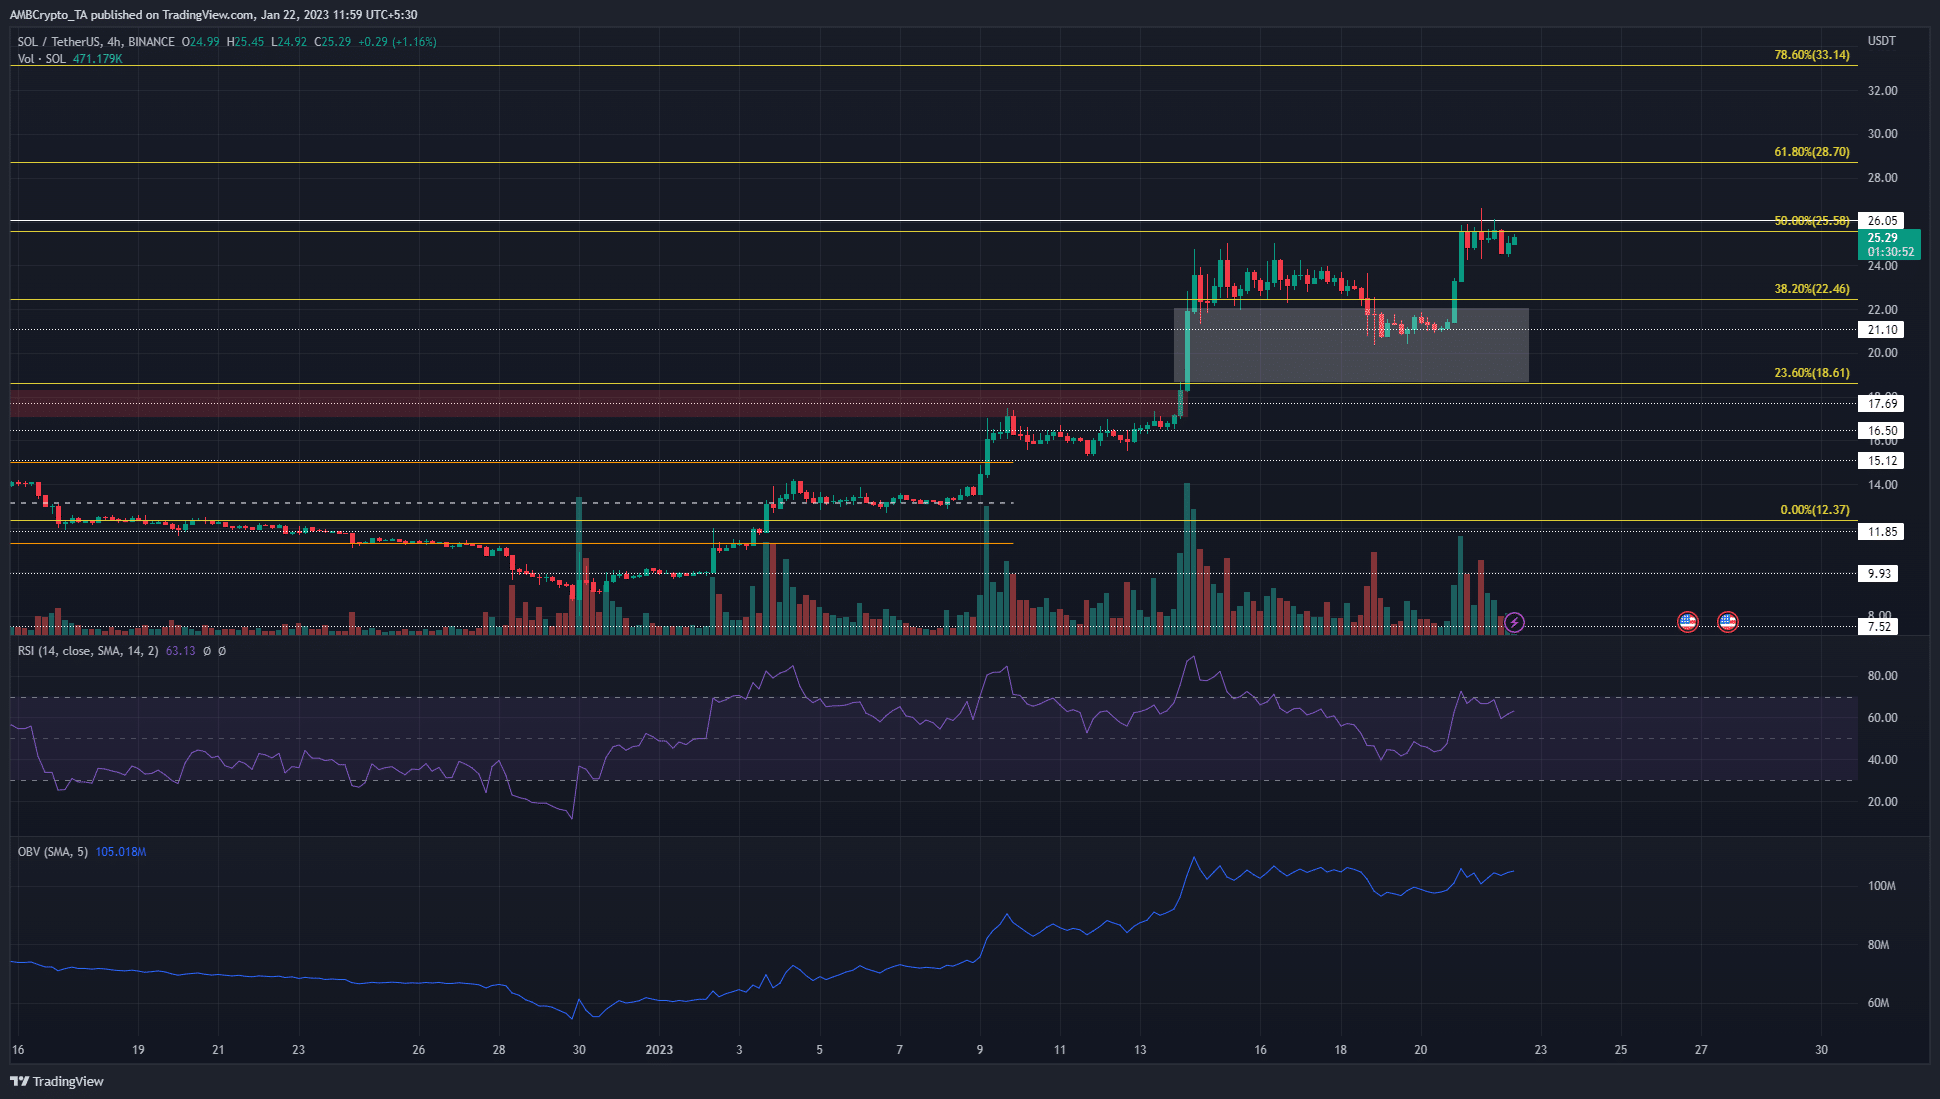
Based on the drop from $38.79 to $12.37 that began on January 5, a set of Fibonacci retracement levels (yellow) was plotted. In the past ten days, the 38.2% and 50% retracement levels of this move have acted as significant support and resistance levels respectively.
Is your portfolio green? Check the Solana Profit Calculator
The red box highlighted a bearish order block on the 12-hour chart which was been beaten on January 14. The resulting surge higher left an inefficiency on the charts on the daily timeframe and was highlighted in white.
Solana faced a lower timeframe rejection at the $24.6 mark and fell to the support level at $21.1 before flipping the market structure bullish once more. At the time of writing, the $24.34 level of support was a good risk-to-reward place to bid SOL at. The 61.8% and 78.6% HTF resistance levels at $28.7 and $33.14 can be used to take a profit.
More risk-averse traders can wait for Bitcoin to retrace toward the $20.6k area and bounce higher before looking for bullish setups on altcoins.
The technical indicators of Solana showed bullish strength. The RSI has climbed back above neutral 50 and stood at 63 to indicate upward momentum. The OBV has stalled over the past two days, but its uptick throughout January showed significant demand behind the rally.
The predicted funding rate remained positive to highlight bullish momentum
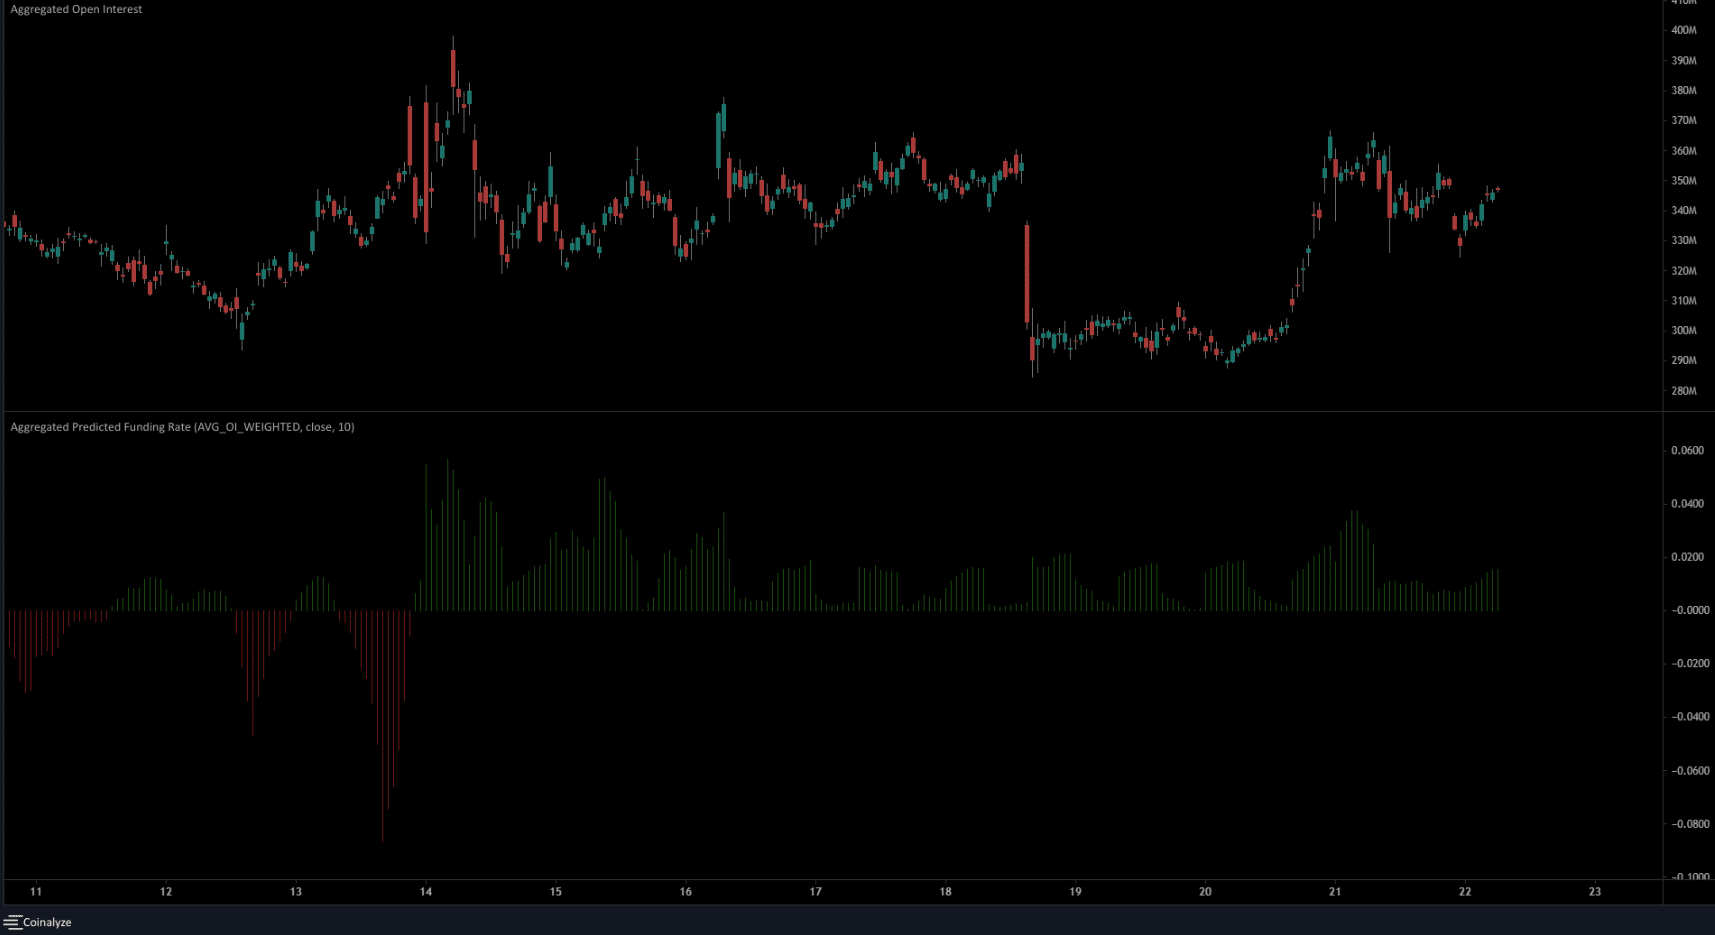
Weighted by Open Interest, the predicted funding rate continued to move in positive territory. This meant long positions paid the short positions, which indicated the futures market had a bullish outlook on the asset.
The Open Interest itself took a sharp hit on January 18 when SOL fell to the $21.1 support. It remained flat for a couple of days and rocketed higher on January 20. The falling OI and the flat prices since then suggested SOL could drop on Monday [23 January] to shake out long positions before driving higher.