
- KAS has declined over the past month, dropping by 26.49%.
- Kaspa experienced a strong downward momentum risk, hitting a six-month low.
While most altcoins have made some gains over the past month, either moderate or significant, Kaspa [KAS] has instead shaped its own path to decline throughout the month.
Over this period, KAS has traded in a descending trendline. At press time, the altcoin was approaching the lower boundary of this channel.
In fact, as of this writing, Kaspa was trading at $0.1265, a 5.21% decline over the past day. The altcoin has dipped by 26.49% on monthly charts, with the extension to the bearish trend by 3.46% on weekly charts.
The current market conditions showed that Kaspa is experiencing extremely high negative sentiment, with investors continually closing their positions.
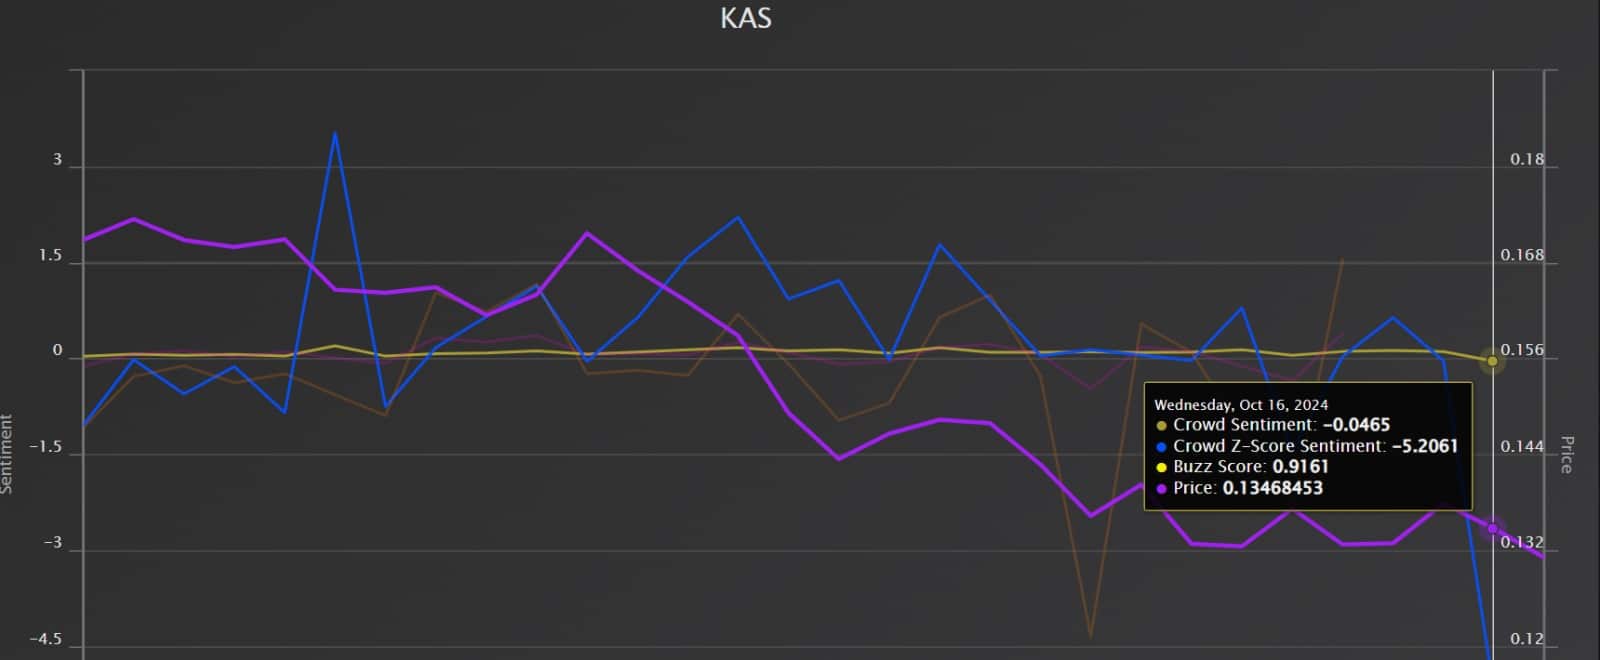
Source: Market Prophit
Inasmuch, AMBCrypto’s analysis of Market Prophit showed Kaspa was experiencing strong negative sentiment. Market sentiment was negative at -0.0465, and the Crowd Z -score sentiment was at -5.2061.
This implied that most investors lacked confidence in the altcoin’s future trajectory.
What Kaspa’s charts say
According to AMBCrypto’s analysis, Kaspa was experiencing a strong downward momentum.
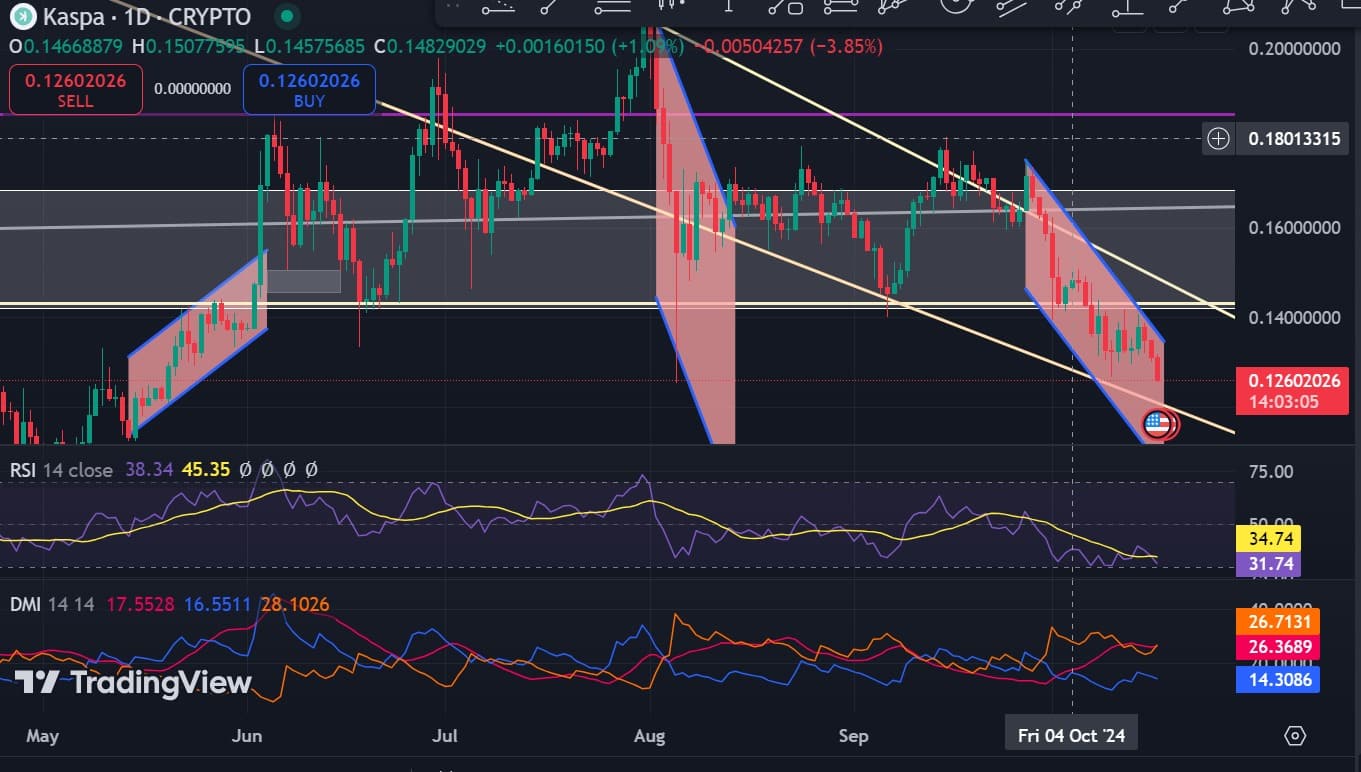
Source: TradingView
For instance, its Relative Strength Index (RSI) has declined to 31, nearing oversold territory. This decline showed that sellers were dominating the market.
This strength in downward momentum was supported by the fact that +DI of the Directional Movement Index (DMI) sits below -DI. So, the downtrend is strong amid potential for continuation of the trend.
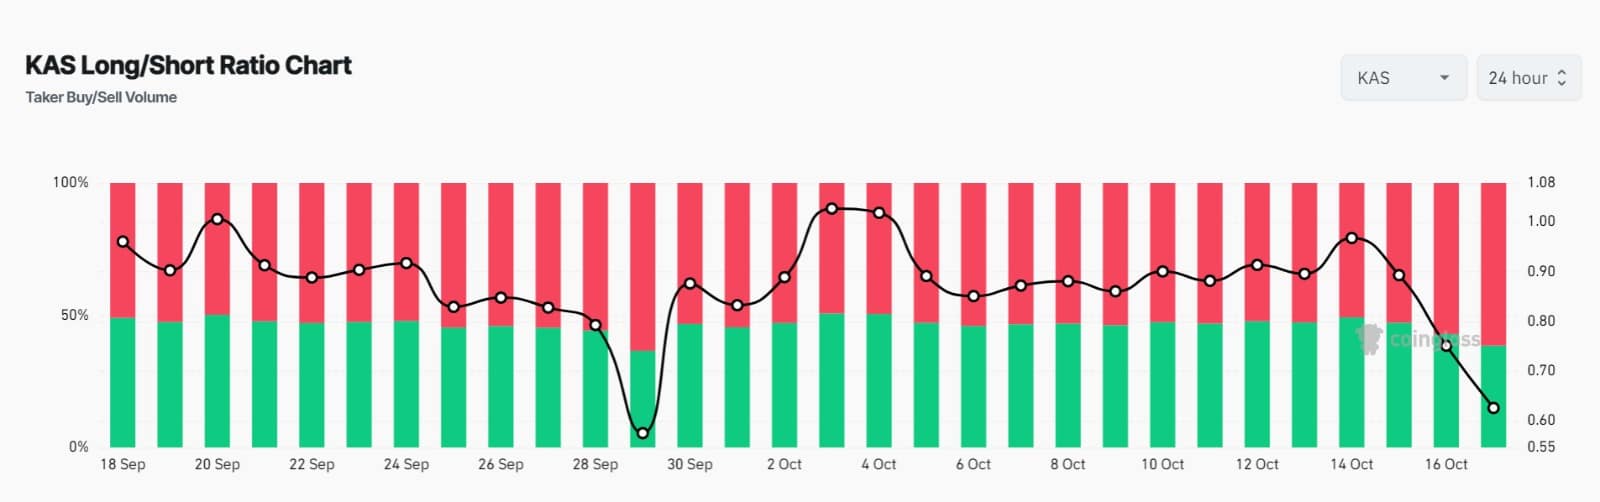
Source: Coinglass
Looking further, Kaspa’s Long/Short Ratio is below 1 after a sustained decline on daily charts. At 0.66, it suggested that short sellers were dominating, with most traders bearish.
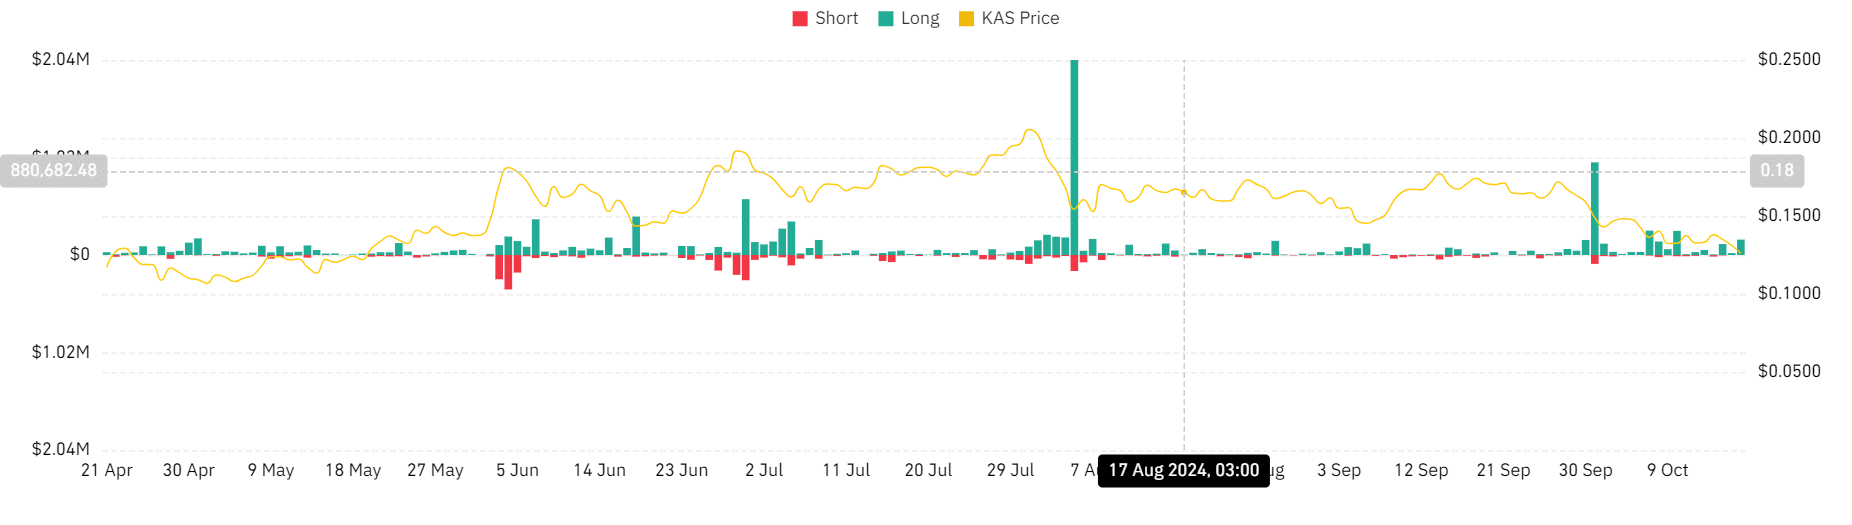
Source: Coinglass
Read Kaspa’s [KAS] Price Prediction 2024–2025
Additionally, Kaspa has majorly experienced long position liquidations over the past two weeks. When longs are liquidated, it reflects a strong downward price movement.
Selling pressure increases when long positions are liquidated, which then accelerates the downtrend.