Kaspa drops after rally to $0.21 – Where will KAS head next?
In the long term, KAS appears poised for a significant rally, potentially reaching a new all-time high.
- Kaspa’s emerging ascending triangle pattern at press time suggested a bullish sentiment.
- KAS could surpass the previous peak of $0.201.
Kaspa [KAS] has remained stagnant for the past month, with the token only making a slight market movement—a 0.95% increase in price over the week.
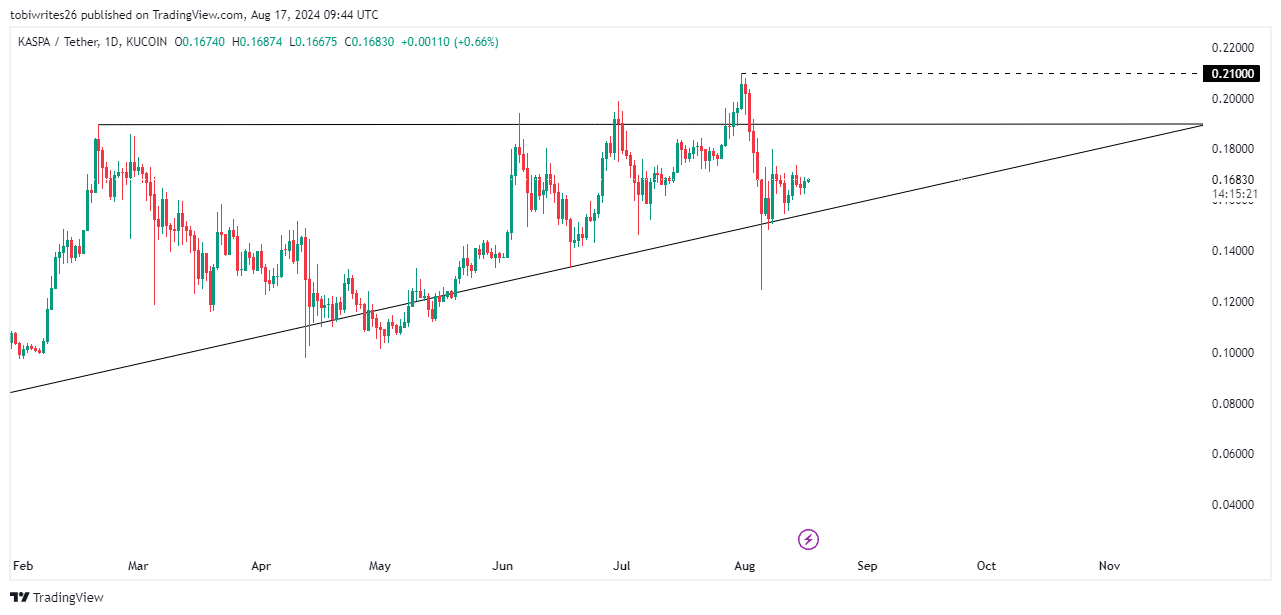
The press time chart formation of an ascending triangle suggested that KAS was positioned for a rally that could propel it to a new all-time high above $0.21.
An ascending triangle is a bullish chart pattern characterized by a flat upper line serving as resistance and a rising lower line acting as support. This setup often leads to a potential upward breakout.
KAS within the ascending triangle
KAS recently broke above the triangle’s upper resistance, reaching a new peak at $0.21. However, it could not maintain this level and slipped back into the pattern, breaching the support at the baseline.
This price action, often referred to as ‘wicking,’ is typically seen as a stop hunt—a strategy used to manipulate the market in favor of major players.
In this instance, the stop hunt aimed to advantage buyers, driving the price down to activate stop-loss orders from bullish traders.
This allowed large investors to accumulate at lower prices before pushing the price upward again for gains.
While the upward trajectory has been gradual, this pattern of accumulation followed by a sharp rise is common and suggests a potential buildup for a significant upward move beyond the current high.
As this scenario unfolds, technical analysis from AMBCrypto shows that indicators like MACD and RSI are tilting toward bullish momentum, reinforcing the potential for an upcoming rally.
More bullish tendencies emerge
Using the Moving Average Convergence Divergence (MACD), there are signs that the anticipated rally within the ascending triangle could be triggered soon, as the indicator gradually moves out of negative territory.
The MACD is a trend-following momentum indicator that displays the relationship between two moving averages of an asset’s price.
A close examination of the chart reveals a shift towards positive territory, with the blue MACD line approaching a crossover above the orange signal line, signaling a potential bullish turn.
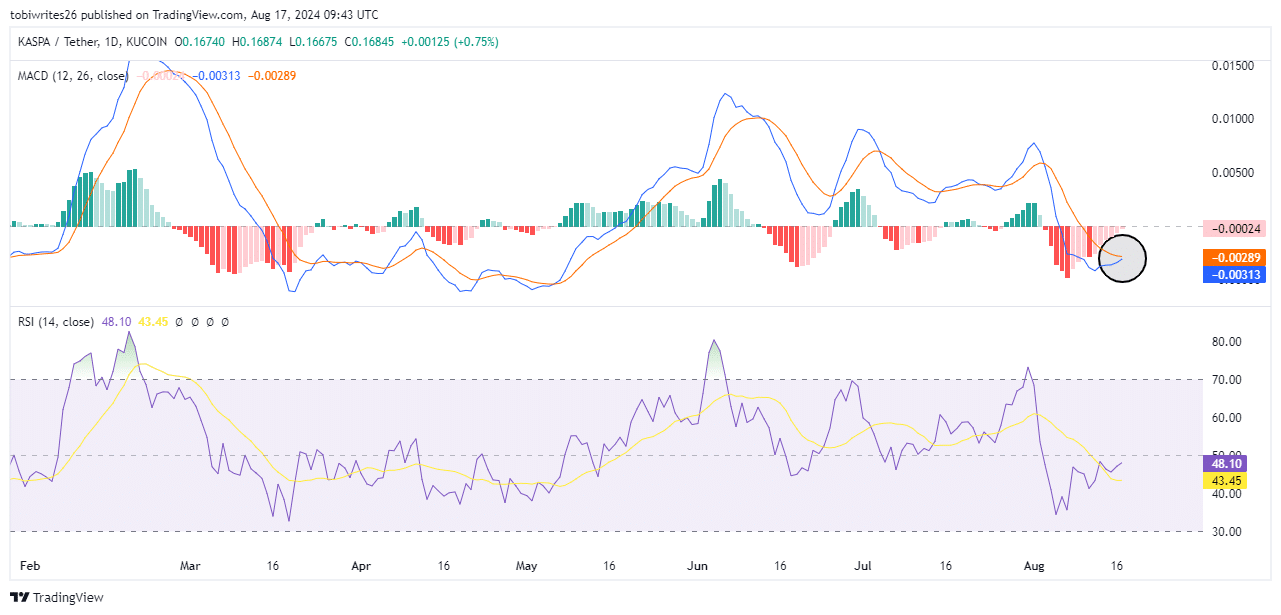
Also, a quicker crossover of the blue line above the orange line strongly confirms the bulls’ increasing dominance.
Concurrently, the Relative Strength Index (RSI), another key momentum indicator that ranges from 0 to 100, supported this bullish outlook.
The RSI measures overbought conditions above 70 and oversold conditions below 30.
With an RSI reading of 46.39, it suggests that bullish momentum is regaining strength, potentially driving KAS’s price higher. This indicates an imminent presence of buyers ready to push the market upward.
Mixed sentiment on-chain
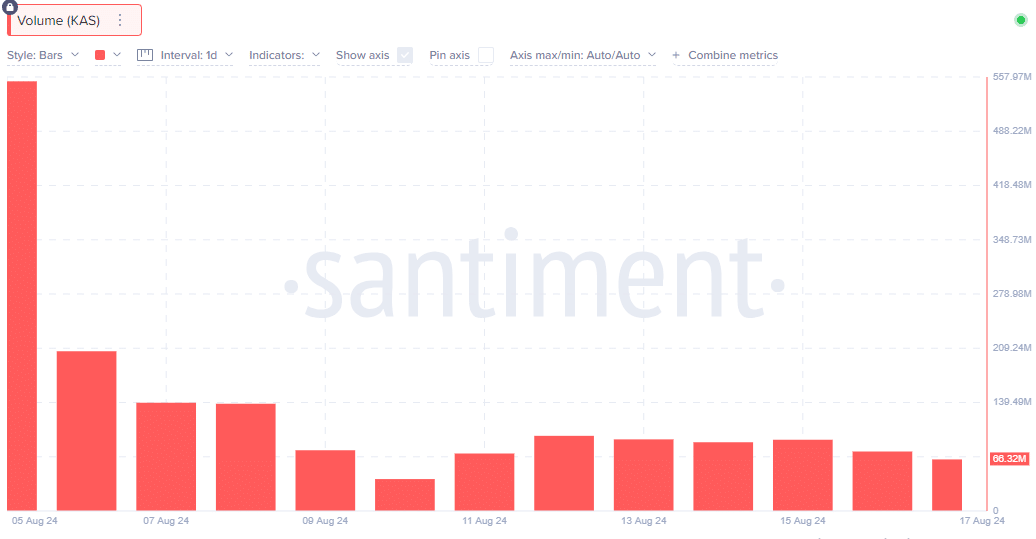
An analysis of Kaspa’s transaction volume via Santiment revealed a significant decrease: from $552.44 million on the 5th of August to just $66.82 million on the 7th of August.
This notable reduction suggested a waning interest in the market, potentially leading to further declines in KAS’s price.
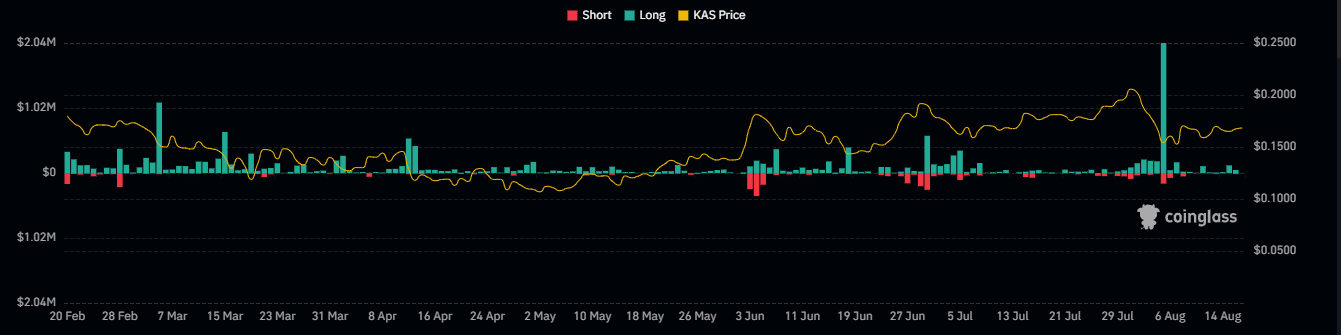
Moreover, liquidation statistics from Coinglass highlighted that an increasing number of traders with long positions on KAS were liquidated from the 7th to the 14th of August.
This usually indicates a notable price drop, resulting in the automatic closure of these long positions due to insufficient margin to cover the losses—a clear sign of a bearish trend.
The concurrent decline in both volume and price pointed to bearish sentiment and a possible prolonged downtrend, reflecting reduced trading activity.
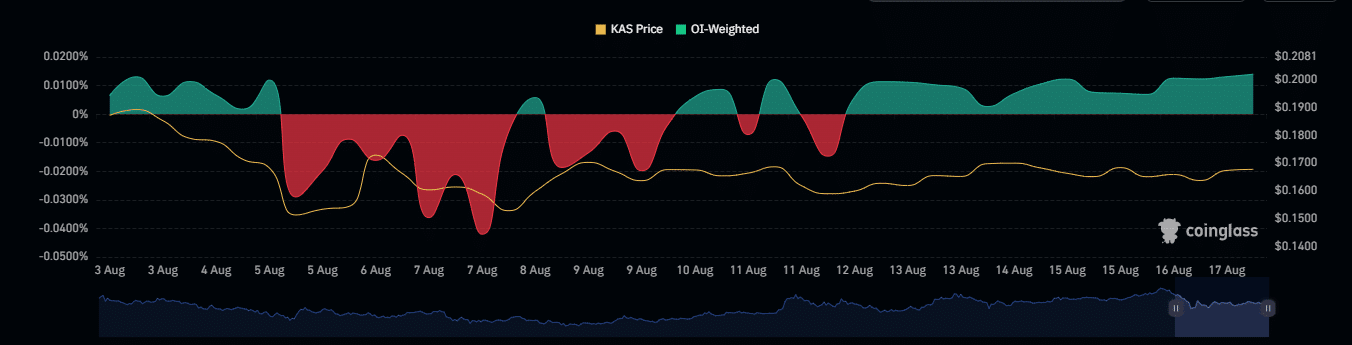
In contrast, the Open Interest (OI)-weighted Funding Rate offered a bullish perspective, remaining positive at 0.0140% and showing an uptick.
This rate suggested that holders of long positions were paying premiums to those holding short positions, indicating stronger demand and a bullish outlook for the asset.
Read Kaspa’s [KAS] Price Prediction 2024-25
With these contrasting indicators, the market is likely on the cusp of gaining clarity and adjusting to either a bullish or bearish bias in the near future.
If the market leans bullish, KAS could potentially break its previous all-time high of $0.21, setting a new record.