L1 vs L2: Will Ethereum emerge unscathed?

- L2 solutions have challenged L1 dominance.
- Surge in L2 dominance impacted NFT activity and fees generated.
The ever-evolving landscape of the cryptocurrency sector continues to captivate enthusiasts worldwide. One intriguing development is the burgeoning rivalry between Layer 1 (L1) networks and Layer 2 (L2) solutions.
Is your portfolio green? Check out the Ethereum Profit Calculator
Unveiling L2’s ascent amidst L1 dominance
In a sector notorious for its fierce competition, the recent surge in L2 solutions stirred speculation about its potential to disrupt the reigning L1 networks.
Despite the established dominance of L1 networks and cryptocurrencies, the spotlight shifted onto the rising prominence of L2s, casting a shadow over the market share of their predecessors.
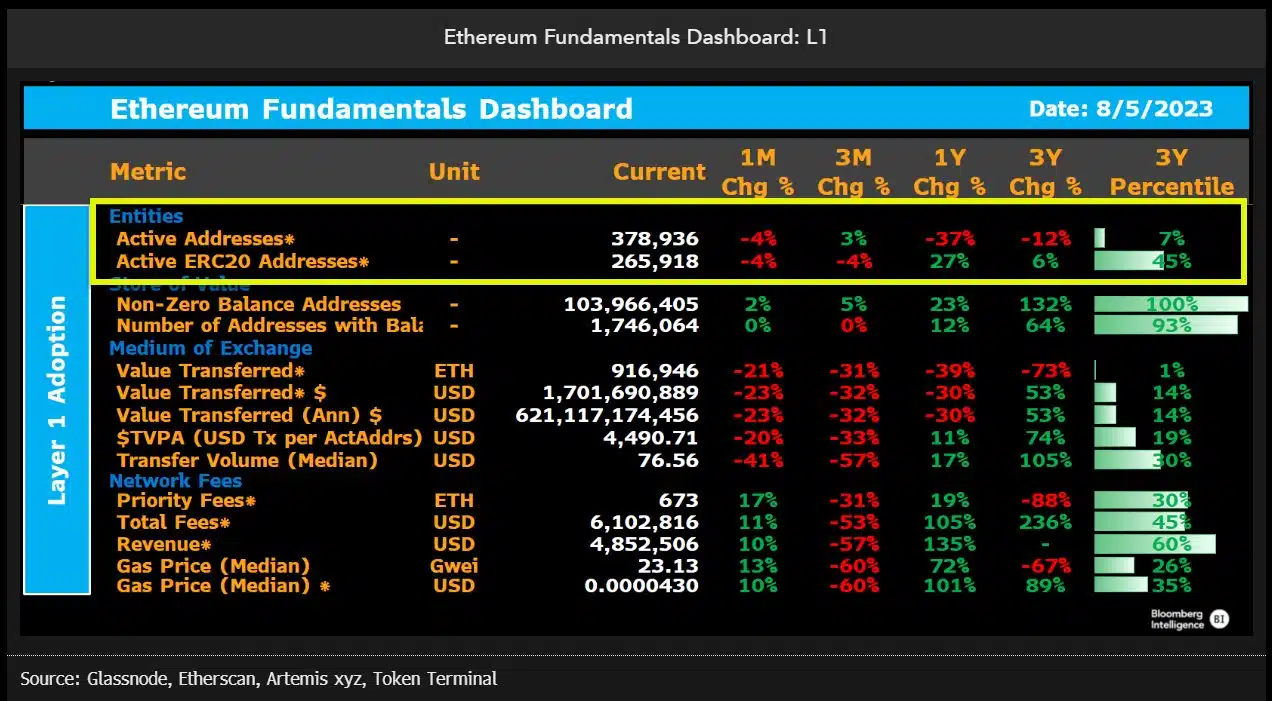
Crypto analyst Jamie Coutts’ data indicated that L2 adoption was growing at a faster rate than expected. This growth could prove to be beneficial for the Ethereum [ETH] network. However, it could harm L1s cryptocurrencies in the short term.
The dual surprise of faster L2 adoption and less than expected cannibalization of the L1 financials has⬆️our confidence in #Ethereum's potential to accrue more value than alternative L1s over the cycle.
A?on the changing dynamics of $ETHs network fundamentals from the⬆️in L2s pic.twitter.com/LVDsvDkI3m— Jamie Coutts CMT (@Jamie1Coutts) August 9, 2023
Taking a deeper look
Within an intricate web of cryptocurrency dynamics, the value beneath the surface is often masked by price fluctuations. The resurgence of growth in L1 networks owes credit to the burgeoning influence of L2 solutions, coupled with a more lenient monetary tightening environment.
Surprisingly, the sector managed to remain deflationary, even during the bear market, with a pre-Merge inflation rate of 4%. Remarkably, despite cooling market activity, Ethereum staking witnessed a noteworthy 38% upsurge over a mere three-month period.
Ethereum’s resolute ambition to amplify its scalability via L2 rollups became evident through on-chain insights. Amidst a decline in L1 activity over the past year, utilization of the network surged, propelling its financials into a phase of unprecedented prosperity.
The past year witnessed a migration of activity to L2 solutions, reshaping the Ethereum landscape remarkably. With a staggering increase of 245% in active addresses, L2 adoption introduced hundreds of thousands of new users to Web3.
Fees and NFTs
As L2 adoption gathered momentum, Ethereum’s economic landscape underwent a transformation in terms of fees as well. The surge in L2 fees, averaging $600,000 daily, has not only mitigated cannibalized L1 revenue but has also catalyzed the amplification of network effects.
L1 fees, underpinned by rollups, were projected to represent a substantial chunk of total fees, reaching 20% by the end of the year and a staggering 50% within the next three years, according to the data. However, this growth could be hindered by the progress of L2s.
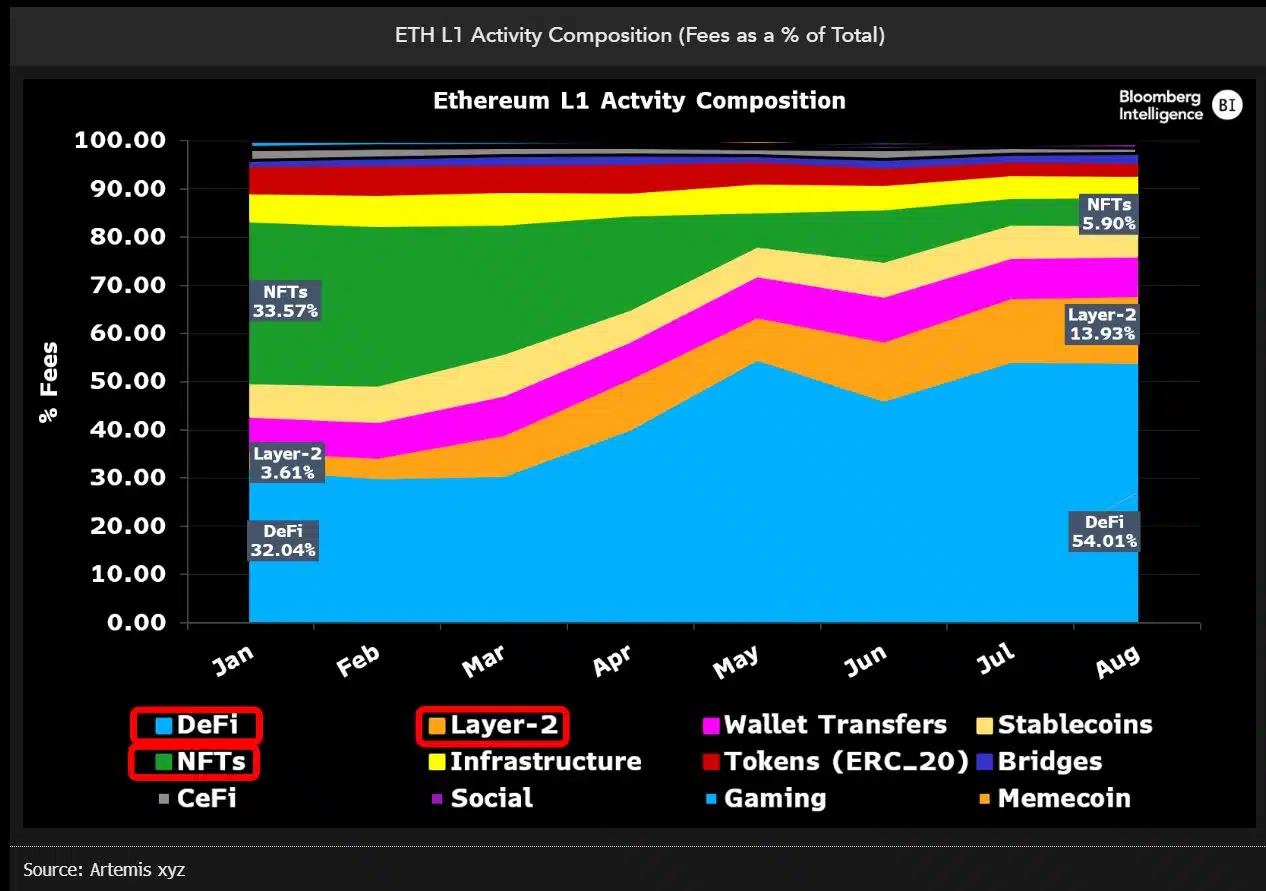
The ascendancy of L2s brought consequential shifts in the realm of NFTs as well. The lower fee costs of L2 NFT marketplaces prompted an 80% reduction in total NFT activity on L1 networks, causing a decline in sales volumes for the same.
Analyzing the tokenomics
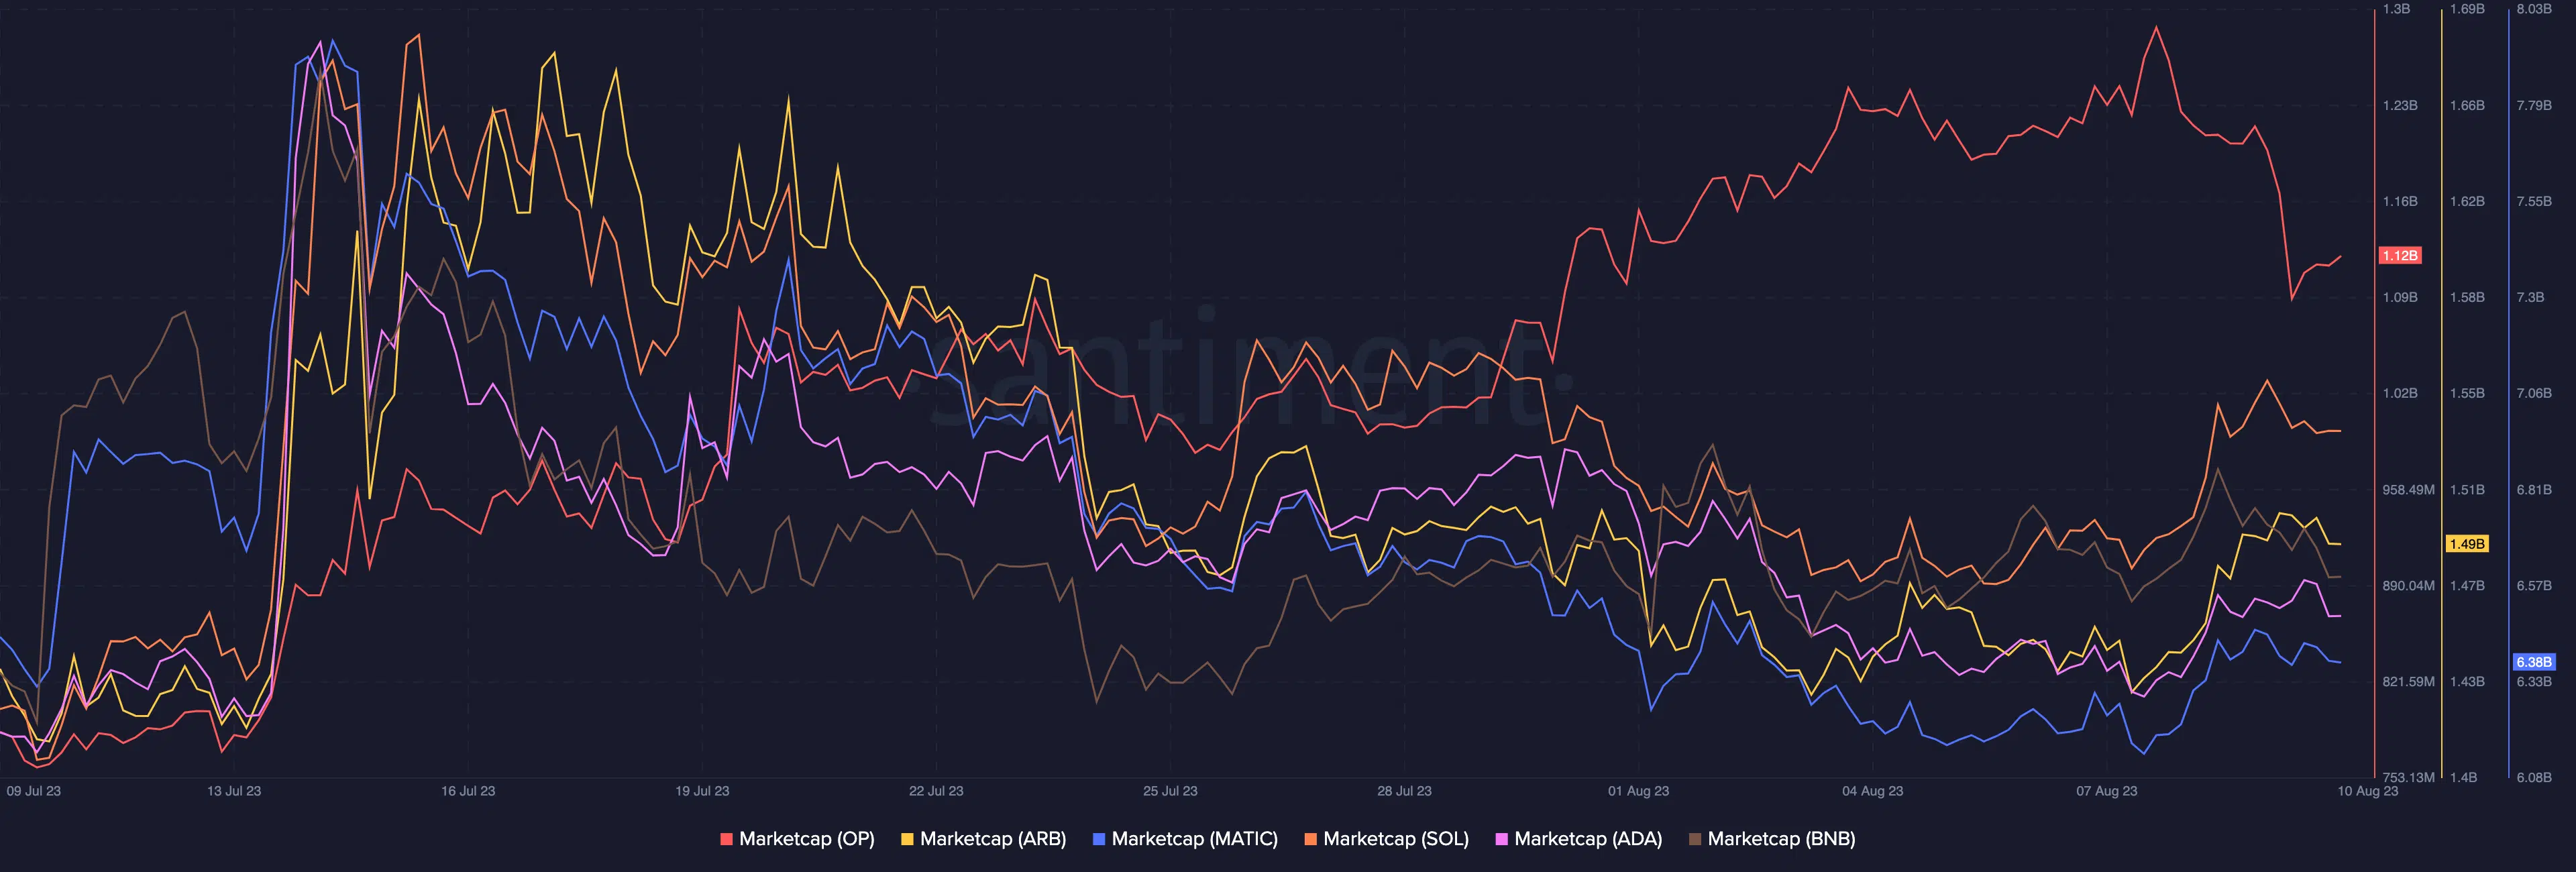
In terms of market cap, both L1 and L2 tokens witnessed similar levels of growth. However, Optimism [OP] stood out in this regard and witnessed the most month-on-month activity according to Santiment’s data.
On the social front, it was seen that the weighted sentiment for both protocols was improving. However, the only exception was Arbitrum, which was the only protocol that witnessed a decline in this area.
L2’s impact on Ethereum
Beyond the borders of the L2 domain, the Ethereum ecosystem stands to benefit from the burgeoning growth of L2 solutions, heralding a potential era of prosperity.
Due to the progress made by layer 2 solutions, the volume of activity that they could bring to the Ethereum network could be extremely large. Because of this, gas usage and revenue accrued by Ethereum will remain consistent.
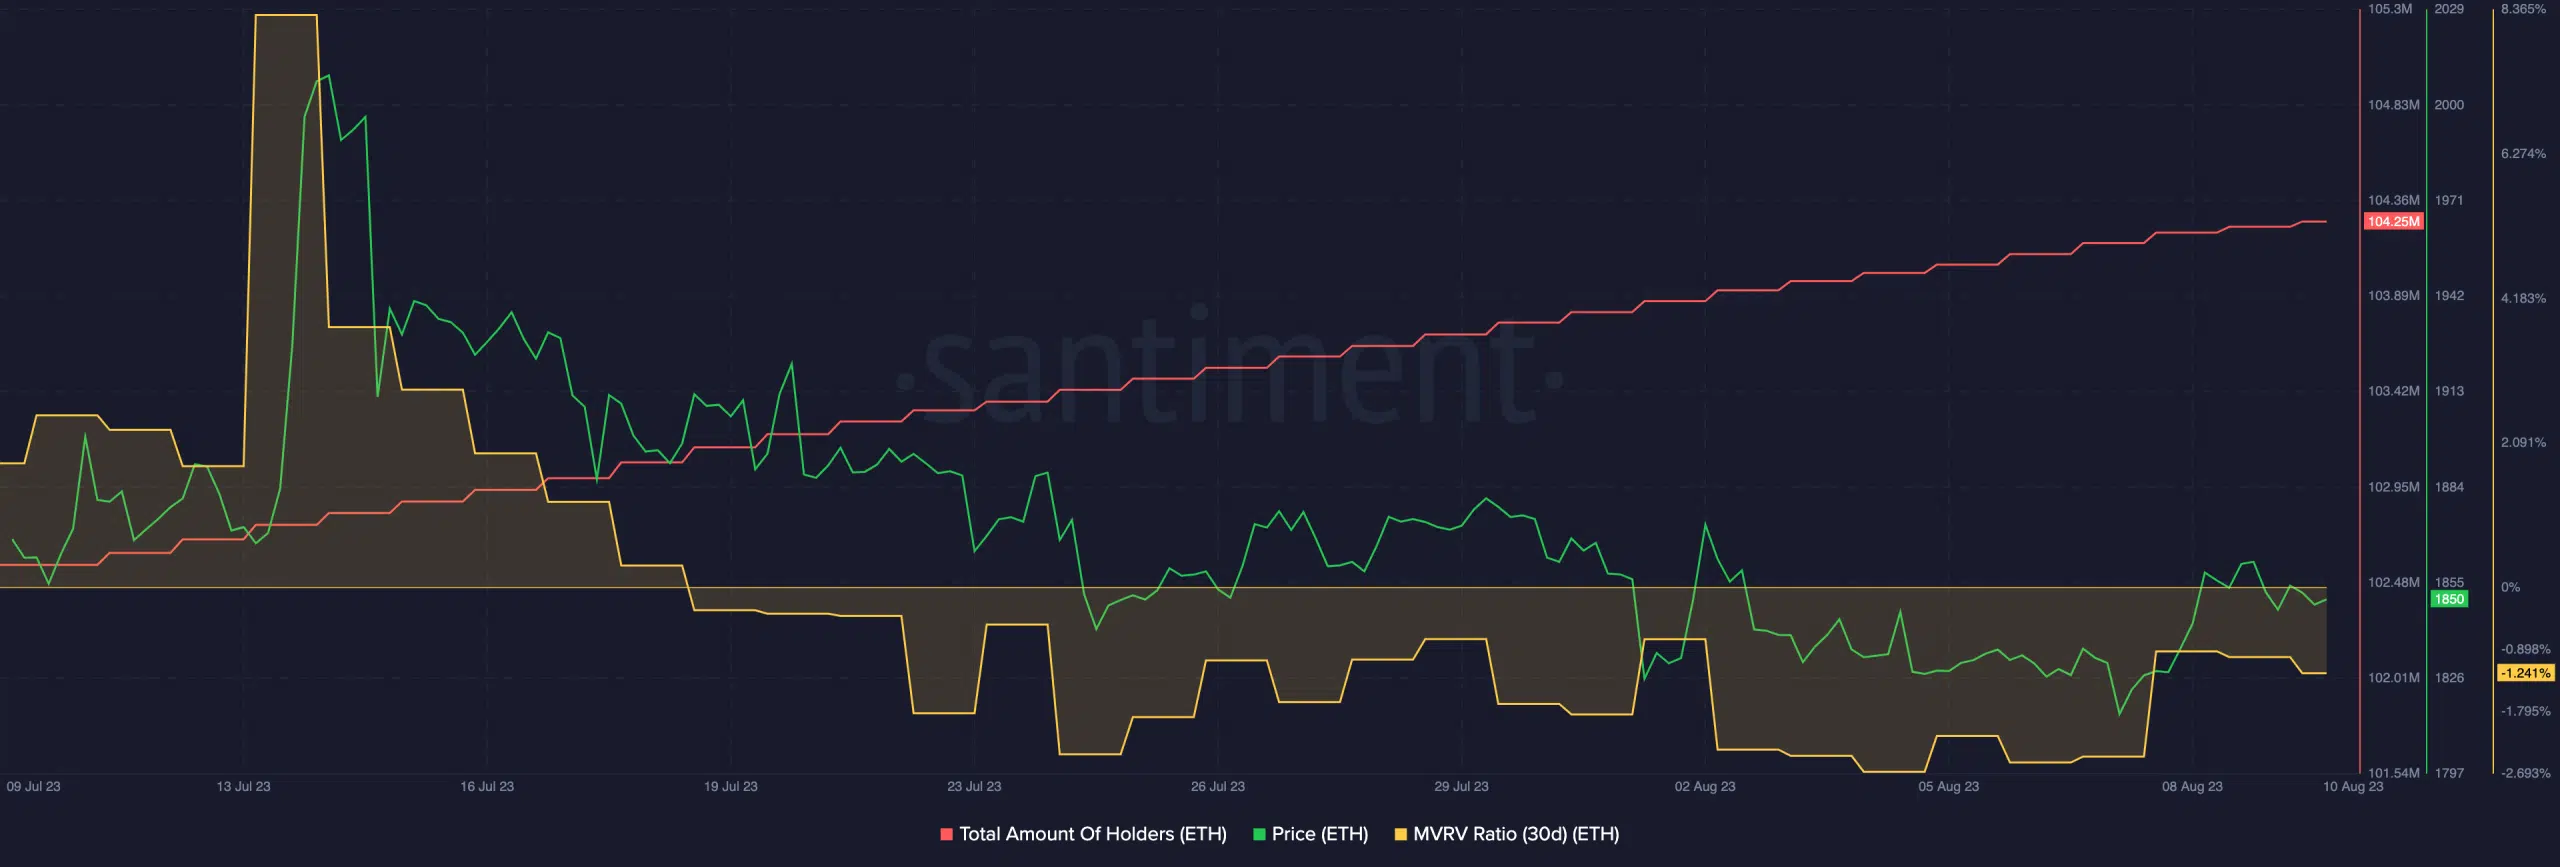
At press time, ETH was trading at $1850. The number of addresses holding ETH has increased over the past week, signaling increased interest in cryptocurrency.
Realistic or not, here’s ETH’s market cap in BTC’s terms
The MVRV ratio for Ethereum during this period declined, showcasing that most addresses holding ETH were not profitable at press time.
The falling MVRV ratio of ETH suggested that the likelihood of ETH being sold was relatively much lower due to lack of an incentive to sell.


