Why LDO’s movement is not good news for Lido’s traders

- Lido witnessed quite a few notable developments over the last seven days
- However, metrics and its price action didn’t exactly mirror the sentiment
Over the last 30 days, Lido [LDO] has majorly operated in the red as per data from CoinMarketCap. At the time of writing, LDO exchanged hands at $2.16 and stood in the green.
LDO’s surge of 5.33% over the last seven days could be attributed to these developments on the network.
Is your portfolio green? Check out the Lido Profit Calculator
Bulls all the way…
As posted by the Lido Finance Twitter account, Lido had quite an eventful week as per data from Dune Analytics. As per the tweet, Lido’s TVL crossed $13 billion for the first time since May 2022. The growth could be attributed to new deposits and a surge in token prices.
Lido’s TVL witnessed a massive 11.24% surge in the last seven days.
? Lido Analytics: May 22 – May 29, 2023
TLDR:
– TVL jumped up 11.24%, to $13.23b.
– Lido captured 43.6% of new Ethereum staking deposits over the last week – total value of 321.2k ETH.
– Weekly net deposit growth for Lido – 320.9k ETH – second to none. pic.twitter.com/T2BM2jmEyQ— Lido (@LidoFinance) May 30, 2023
Furthermore, Lido deposits were 35 times larger than the requested withdrawals last week. The requested figure stood at 8,998 ETH whereas the finalized claims stood at 8,523 ETH as of 30 May. That wasn’t all as Lido also managed to take 43.6% of new ETH staking deposits with a total value of 321.2k ETH.
⚡️ Lido Withdrawals
Lido deposits were 35 times larger than requested withdrawals last week.
– Requested: 8,998 ETH
– Finalised: 8,523 ETH
– Claimed: 14,471 ETHNote: the amount claimed might exceed the amount requested when users claim tokens requested in previous periods.
— Lido (@LidoFinance) May 30, 2023
All these signs showed tremendous growth for the liquid staking protocol. However, despite all the aforementioned developments, these LDO metrics didn’t seem to favor the altcoin’s position.
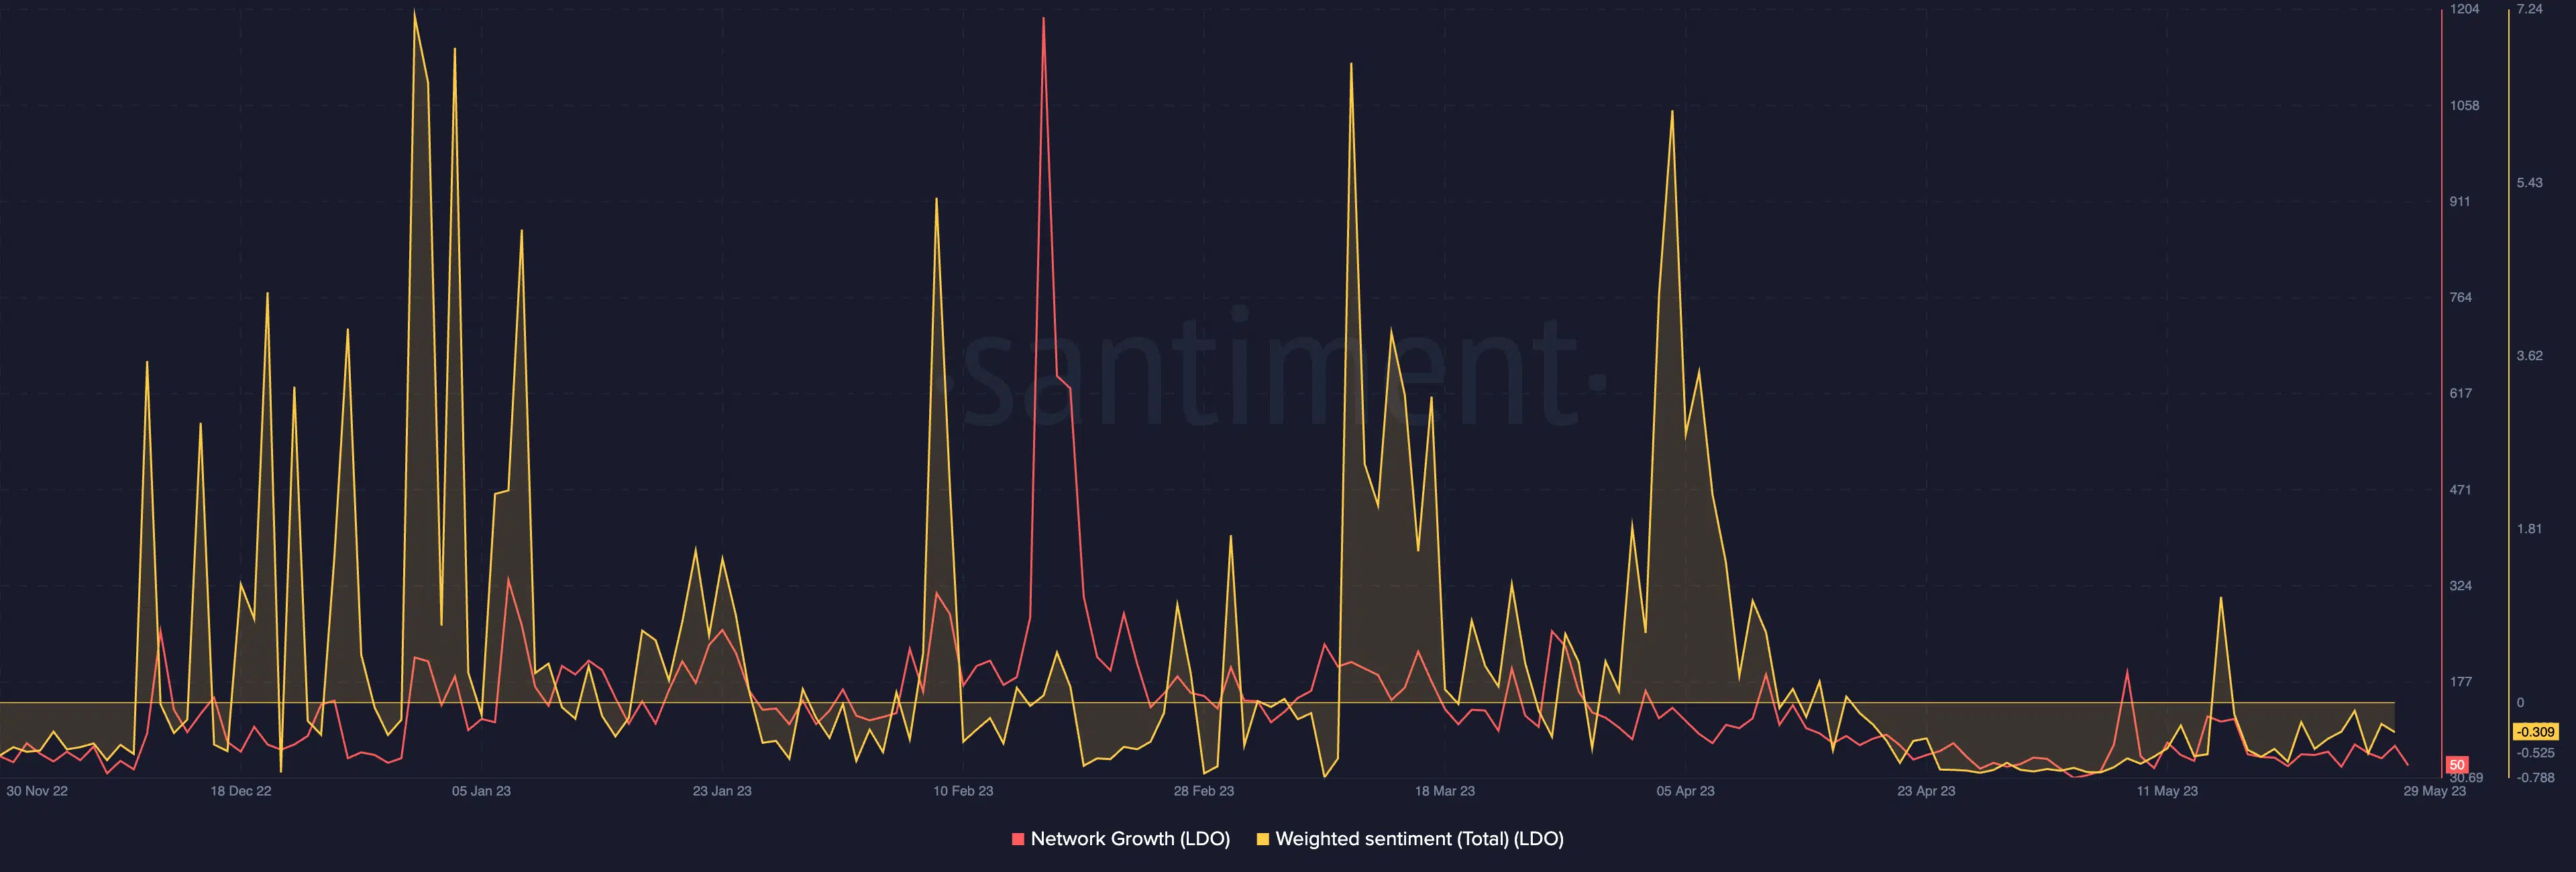
As can be seen from the chart given below, LDO’s network growth wasn’t anywhere near its high of February 2023. To add to the sentiment, its network growth dropped as of 29 May and stood at 50 at the time of writing.
Furthermore, the weighted sentiment toward LDO also stayed quite far from its last peak of April and at the time of writing, stood at -0.309. This wasn’t a great sign for the LDO token despite quite the buzz it created on the performance front over the last seven days.
A diminishing momentum on the price charts
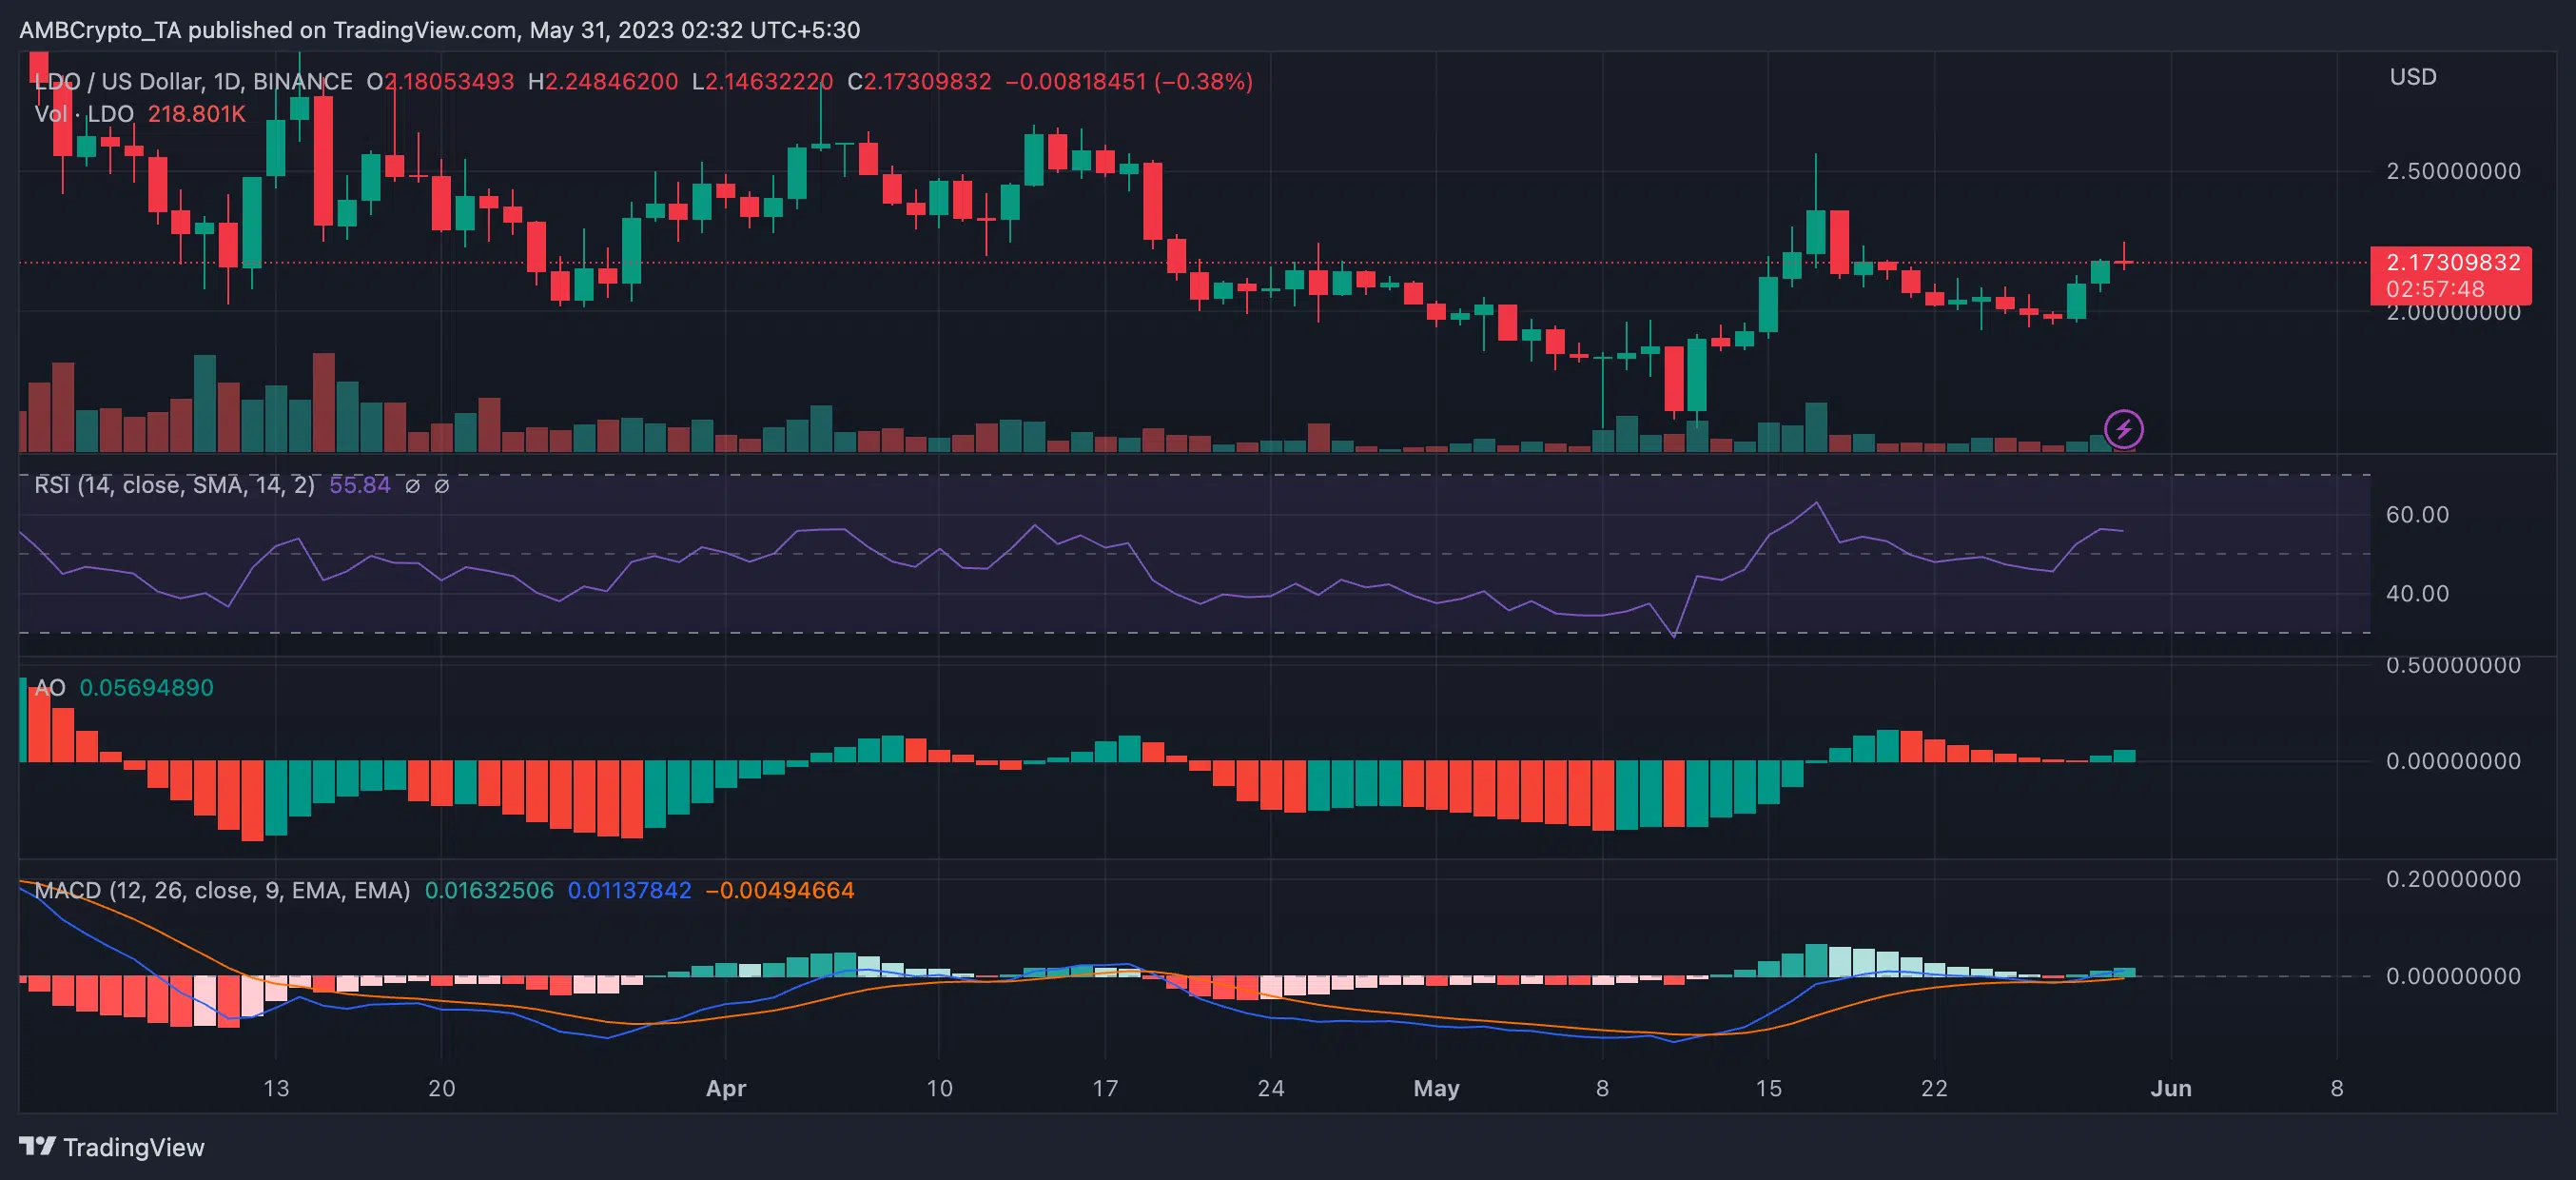
LDO’s price action at the time of writing didn’t favor a clear bullish or bearish sentiment and preferred to stay between the two extremes. LDO’s Relative Strength Index (RSI) hovered above the neutral line indicating the presence of some buying pressure. However, the RSI could move the other way considering its press time position of a slight tilt towards the neutral line.
Realistic or not, here’s LDO’s market cap in BTC’s terms
Furthermore, the Awesome Oscillator (AO) although flashed green above the zero line, could fall back below the zero line in light of rising selling pressure. Additionally, the Moving Average Convergence Divergence (MACD) line (blue) also moved above the signal line (red) which was a bullish sign.
However, the closeness of both lines depicted that the bullish momentum wasn’t enough to anticipate a full-fledged bullish rally.


