As Lido eases its dive, will bulls prevail

Disclaimer: The information presented does not constitute financial, investment, trading, or other types of advice and is solely the writer’s opinion.
- LDO’s plunge retested its mid-range level.
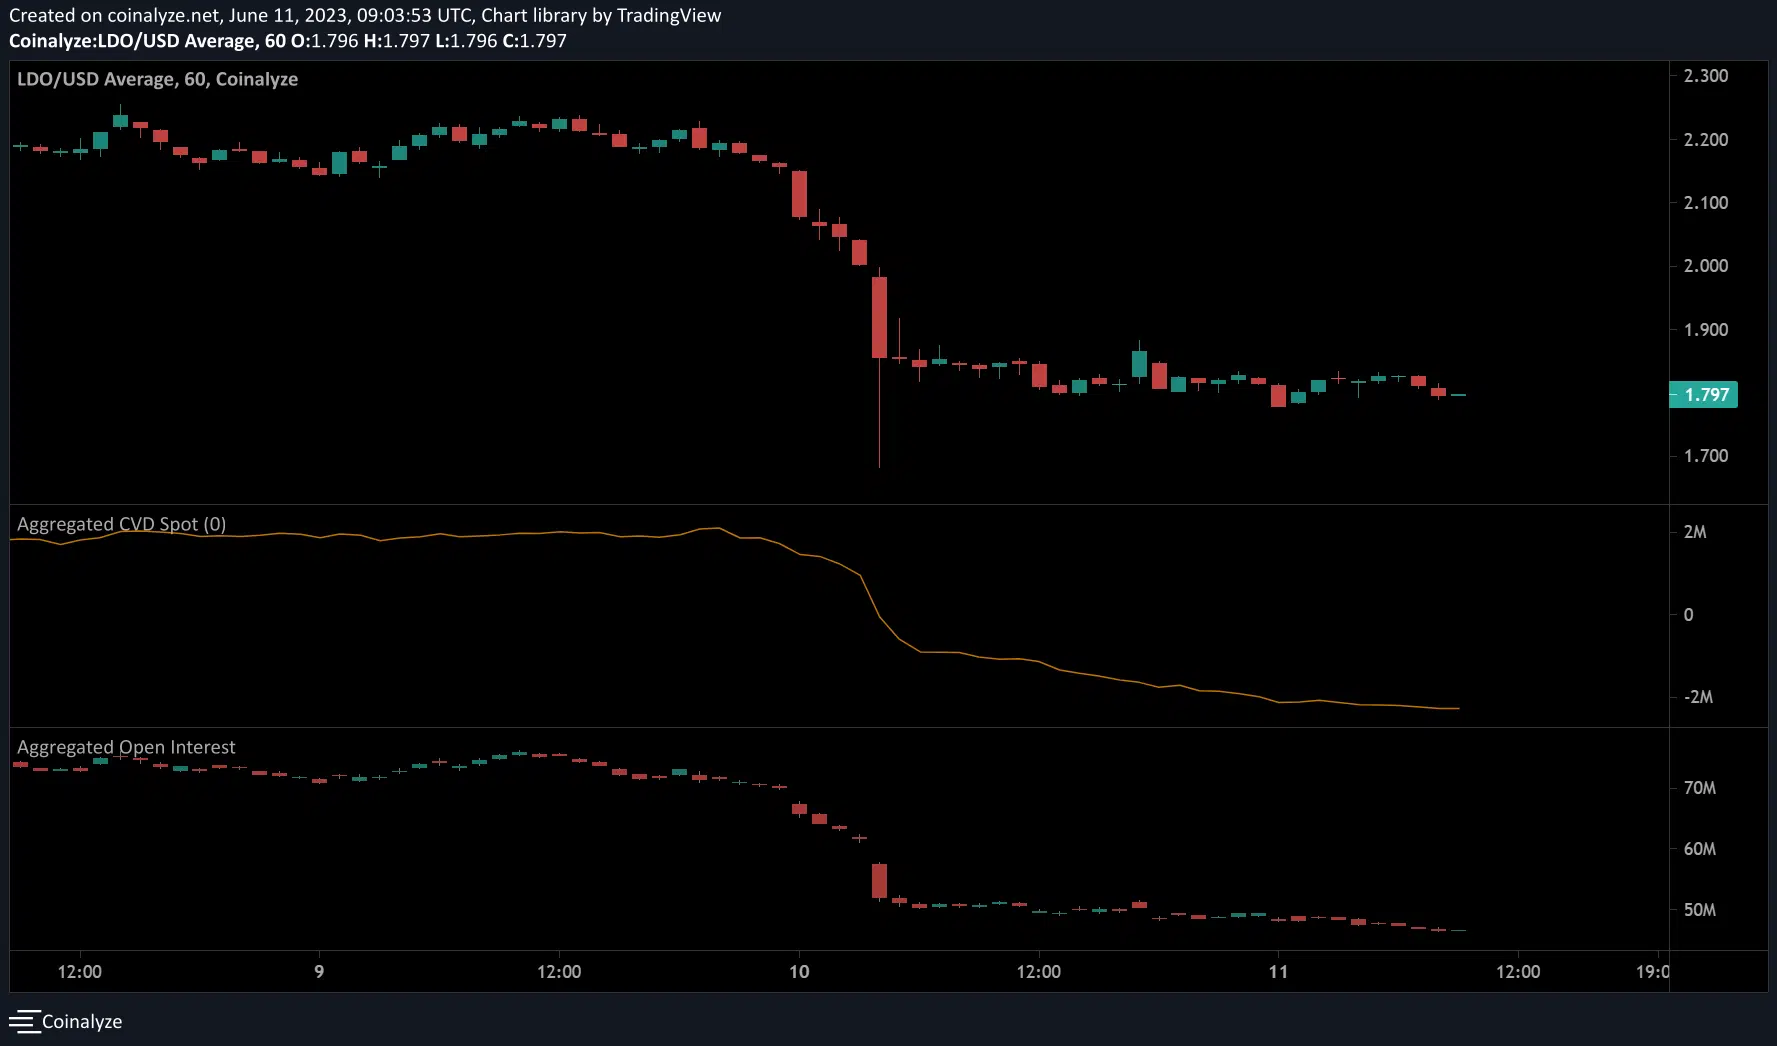
- The token’s CVD and OI declined.
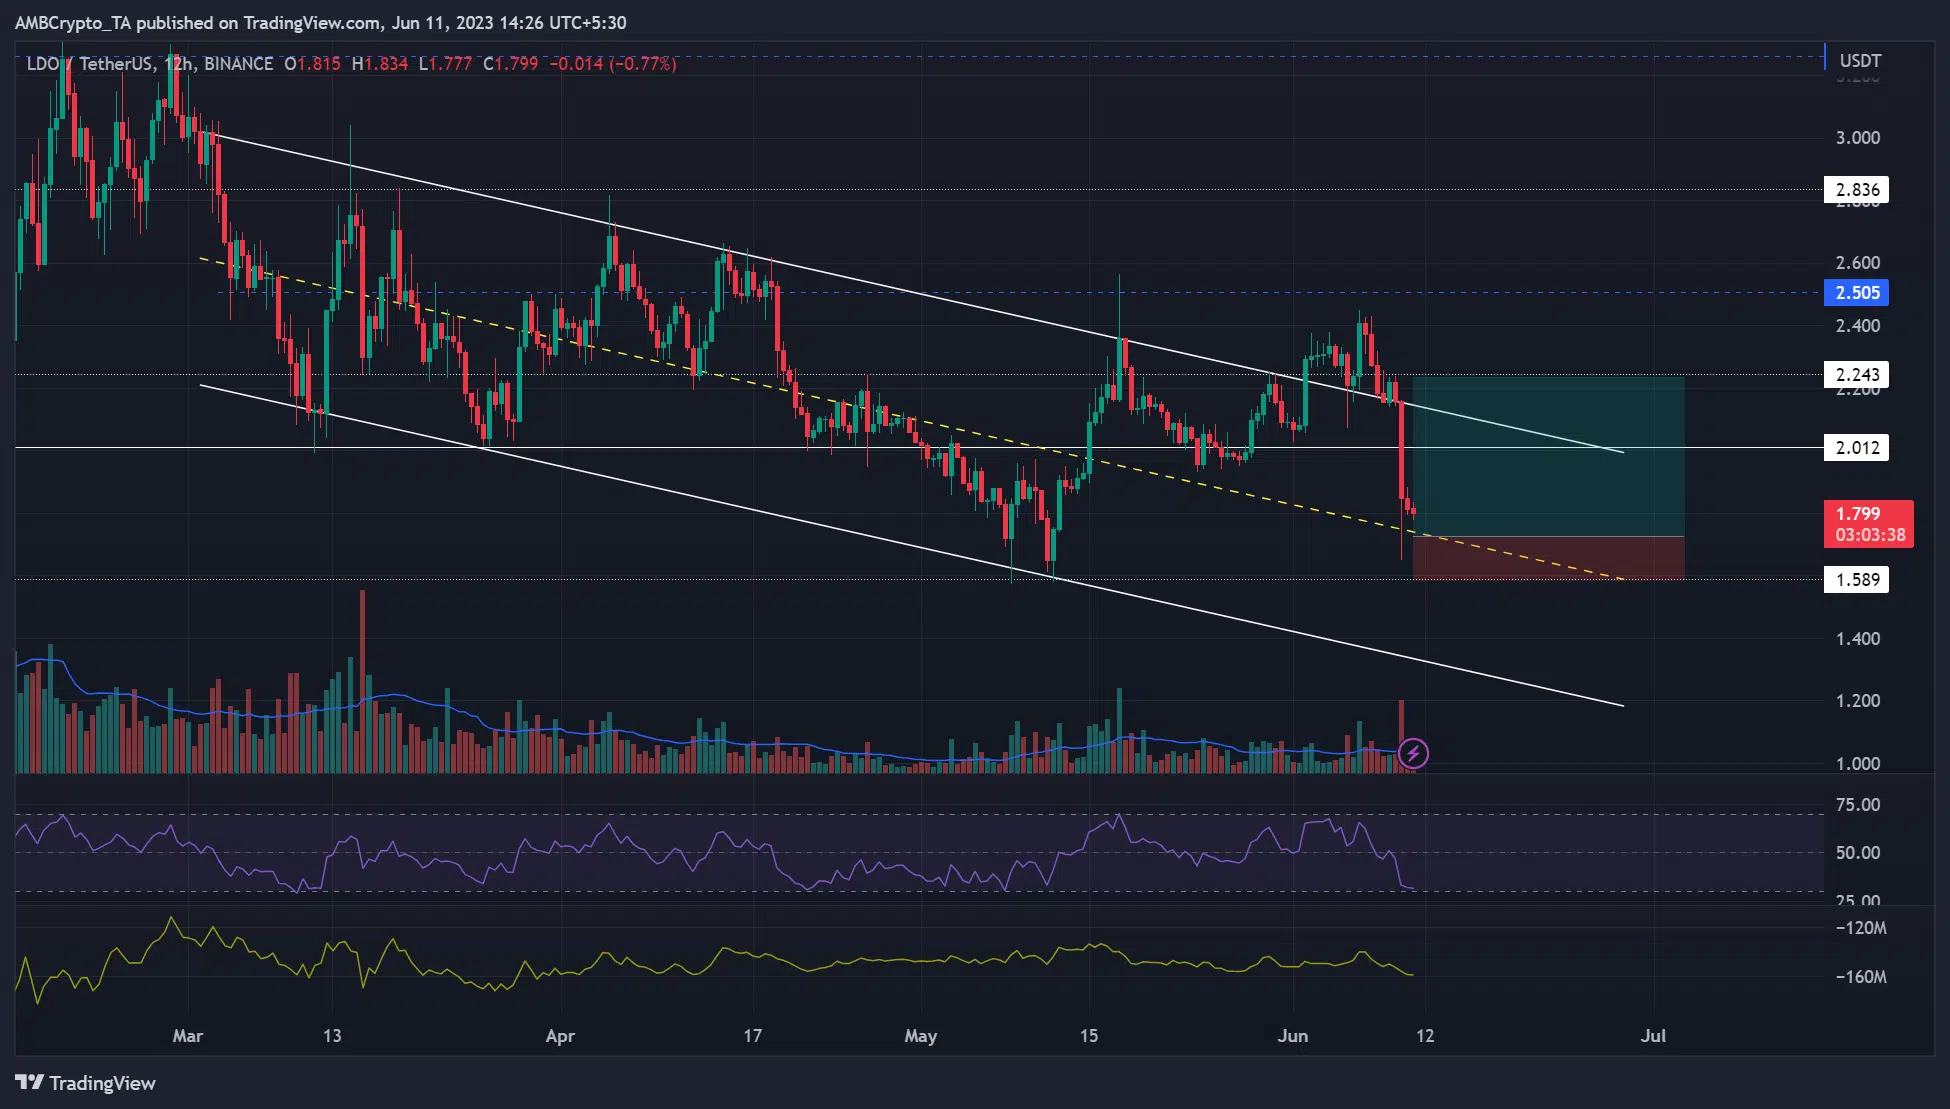
Throughout May, Lido [LDO] made lower lows and lower highs, chalking a descending channel (white). However, it inflicted a mild bullish momentum at the beginning of June, climbing above the range low.
Read Lido [LDO] Price Prediction 2023-24
But the upside move turned out to be a “fake-out,” as LDO dropped back to the channel after Bitcoin [BTC] retested the $25k price zone.
At press time, LDO’s price was $1.8 after easing near the mid-range of descending channel.
Will bulls defend the mid-range?
The mid-range level near $1.73 is a key obstacle sellers must clear to gain an edge and extend more gains. But the lower candlestick wick shows that bulls could be determined to defend the level.
If BTC flips to bullish before or after the FOMC meeting on 13/14 June, LDO bulls could attempt to secure the mid-range and target the range low or above. If that’s the case, buying at the current level could offer a good risk ratio if LDO retests the range high or $2.24.
But a close below the mid-range and subsequent push below $1.59 will invalidate the bullish thesis. Such a downswing could drag LDO to the range low of $1.3, offering sellers more gains, especially if BTC falters at $26.6k.
Meanwhile, the RSI extended into the oversold zone as Accumulation/Distribution eased too, denoting increased selling pressure.
CVD and OI declined
How much are 1,10,100 LDOs worth today?
Similarly, Coinalyze’s open interest (OI) rates and CVD (Cumulative Volume Delta) confirmed the price chart’s technical indicators. The declining OI, from >$70 million to <$50 million at press time, indicates a drop in open contracts for LDO in the futures market.
Also, the declining CVD spot denotes increasing leverage for sellers, thus reinforcing the bearish outlook for LDO. However, the sentiment could change with the start of next week, and tracking BTC price action and market reaction to the FOMC meeting is crucial.


