Lido Finance: Decline in TVL, re-emergence of bears, and everything in between

- Due to the fall in prices of some native coins, Lido’s TVL declined in the last week.
- The buying pressure for LDO has declined significantly, and a price drawback might be on the horizon.
Lido Finance [LDO], a prominent liquid staking protocol, experienced a drop in its Total Value Locked (TVL) in the past week as a result of a decrease in the values of the native coins within its operating networks, including Ethereum [ETH], Polygon [MATIC], Solana [SOL], Polkadot [DOT], and Kusama [KSM].
⚡️Lido TVL
Lido staking deposits grew across all Lido chains except Kusama. However, decreases in native token prices (incl ETH price 7d: -2.7%) contributed to a TVL decrease.
— Lido (@LidoFinance) January 30, 2023
Read Lido’s [LDO] Price Prediction 2023-24
According to data from cryptocurrency price tracker CoinMarketCap, ETH’s price fell 4% in the last seven days. Likewise, the prices of SOL, DOT, and KSM fell by 3%, 6%, and 5%, respectively.
At press time, Lido’s TVL was $8.01 billion, having declined by 3% in the last week.
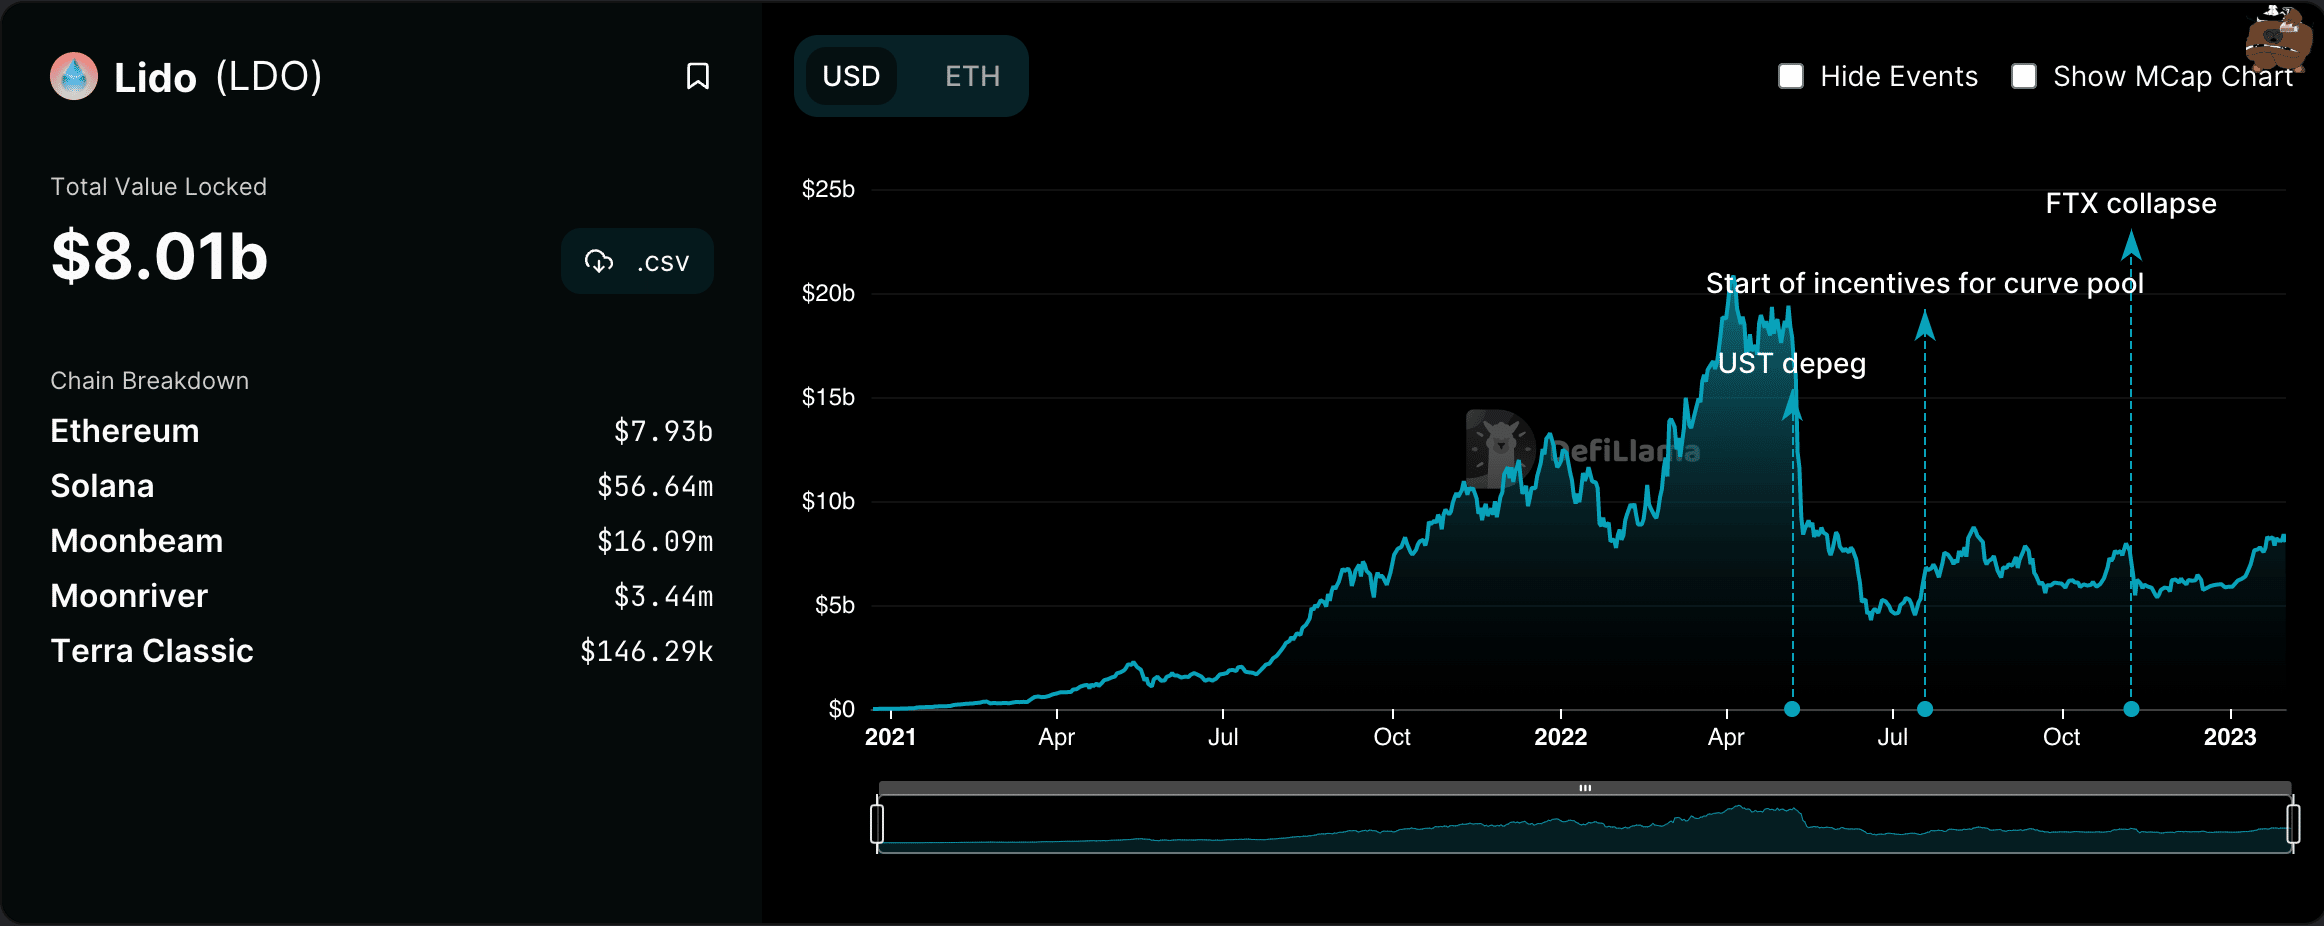
The decline in TVL on Lido occurred despite the launch of a new ETH/LDO factory pool, which gained over $16 million in the last week.
LDO/ETH @LidoFinance pool just got added. It has a vote for gauge [https://t.co/WazdZtth2F] (so please vote!) but in the meantime showing some healthy APY in LDO for depositorshttps://t.co/NMVLmRI4mH pic.twitter.com/rkT0oLgLlM
— Curve Finance (@CurveFinance) January 25, 2023
Trouble in Lido’s paradise?
It is no longer news that Lido’s dominance of the liquid staking market has come under threat because of the rise in activity on centralized crypto exchange Coinbase.
According to Delphi Digital, Lido’s market share, which was 85% at the start of 2022, has decreased to 73% following Coinbase’s entry into the liquid staking market in June 2022.
Currently, the dominant player here is @LidoFinance.
However, its market share has consistently declined since Coinbase's entry into the liquid staking market in June 2022.
While Lido's market share stood at 85% in the beginning of 2022, it has since come down to 73%. pic.twitter.com/5gVKXq36cx
— Delphi Digital (@Delphi_Digital) January 28, 2023
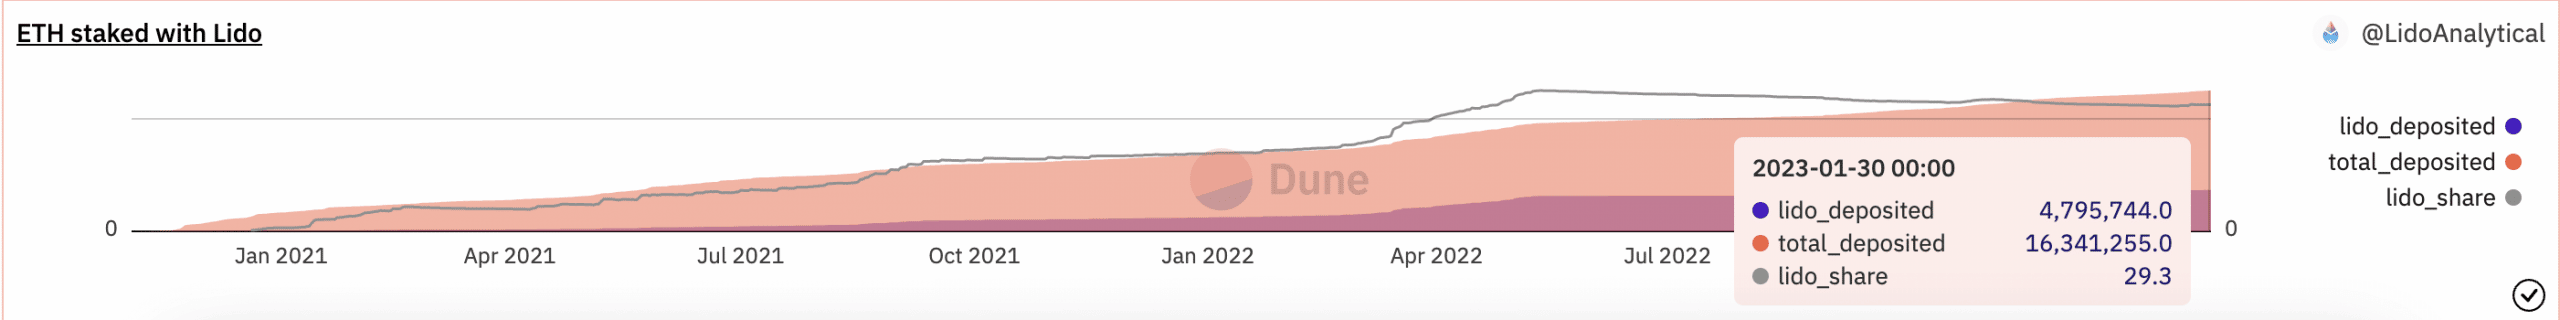
Narrowing it down to the ETH staking market, data from Dune Analytics revealed a persistent drop in Lido’s share of that vertical. As of this writing, Lido only controlled 29% of the market. On May 22, this stood at 32%.
Your LDO gains might be in trouble
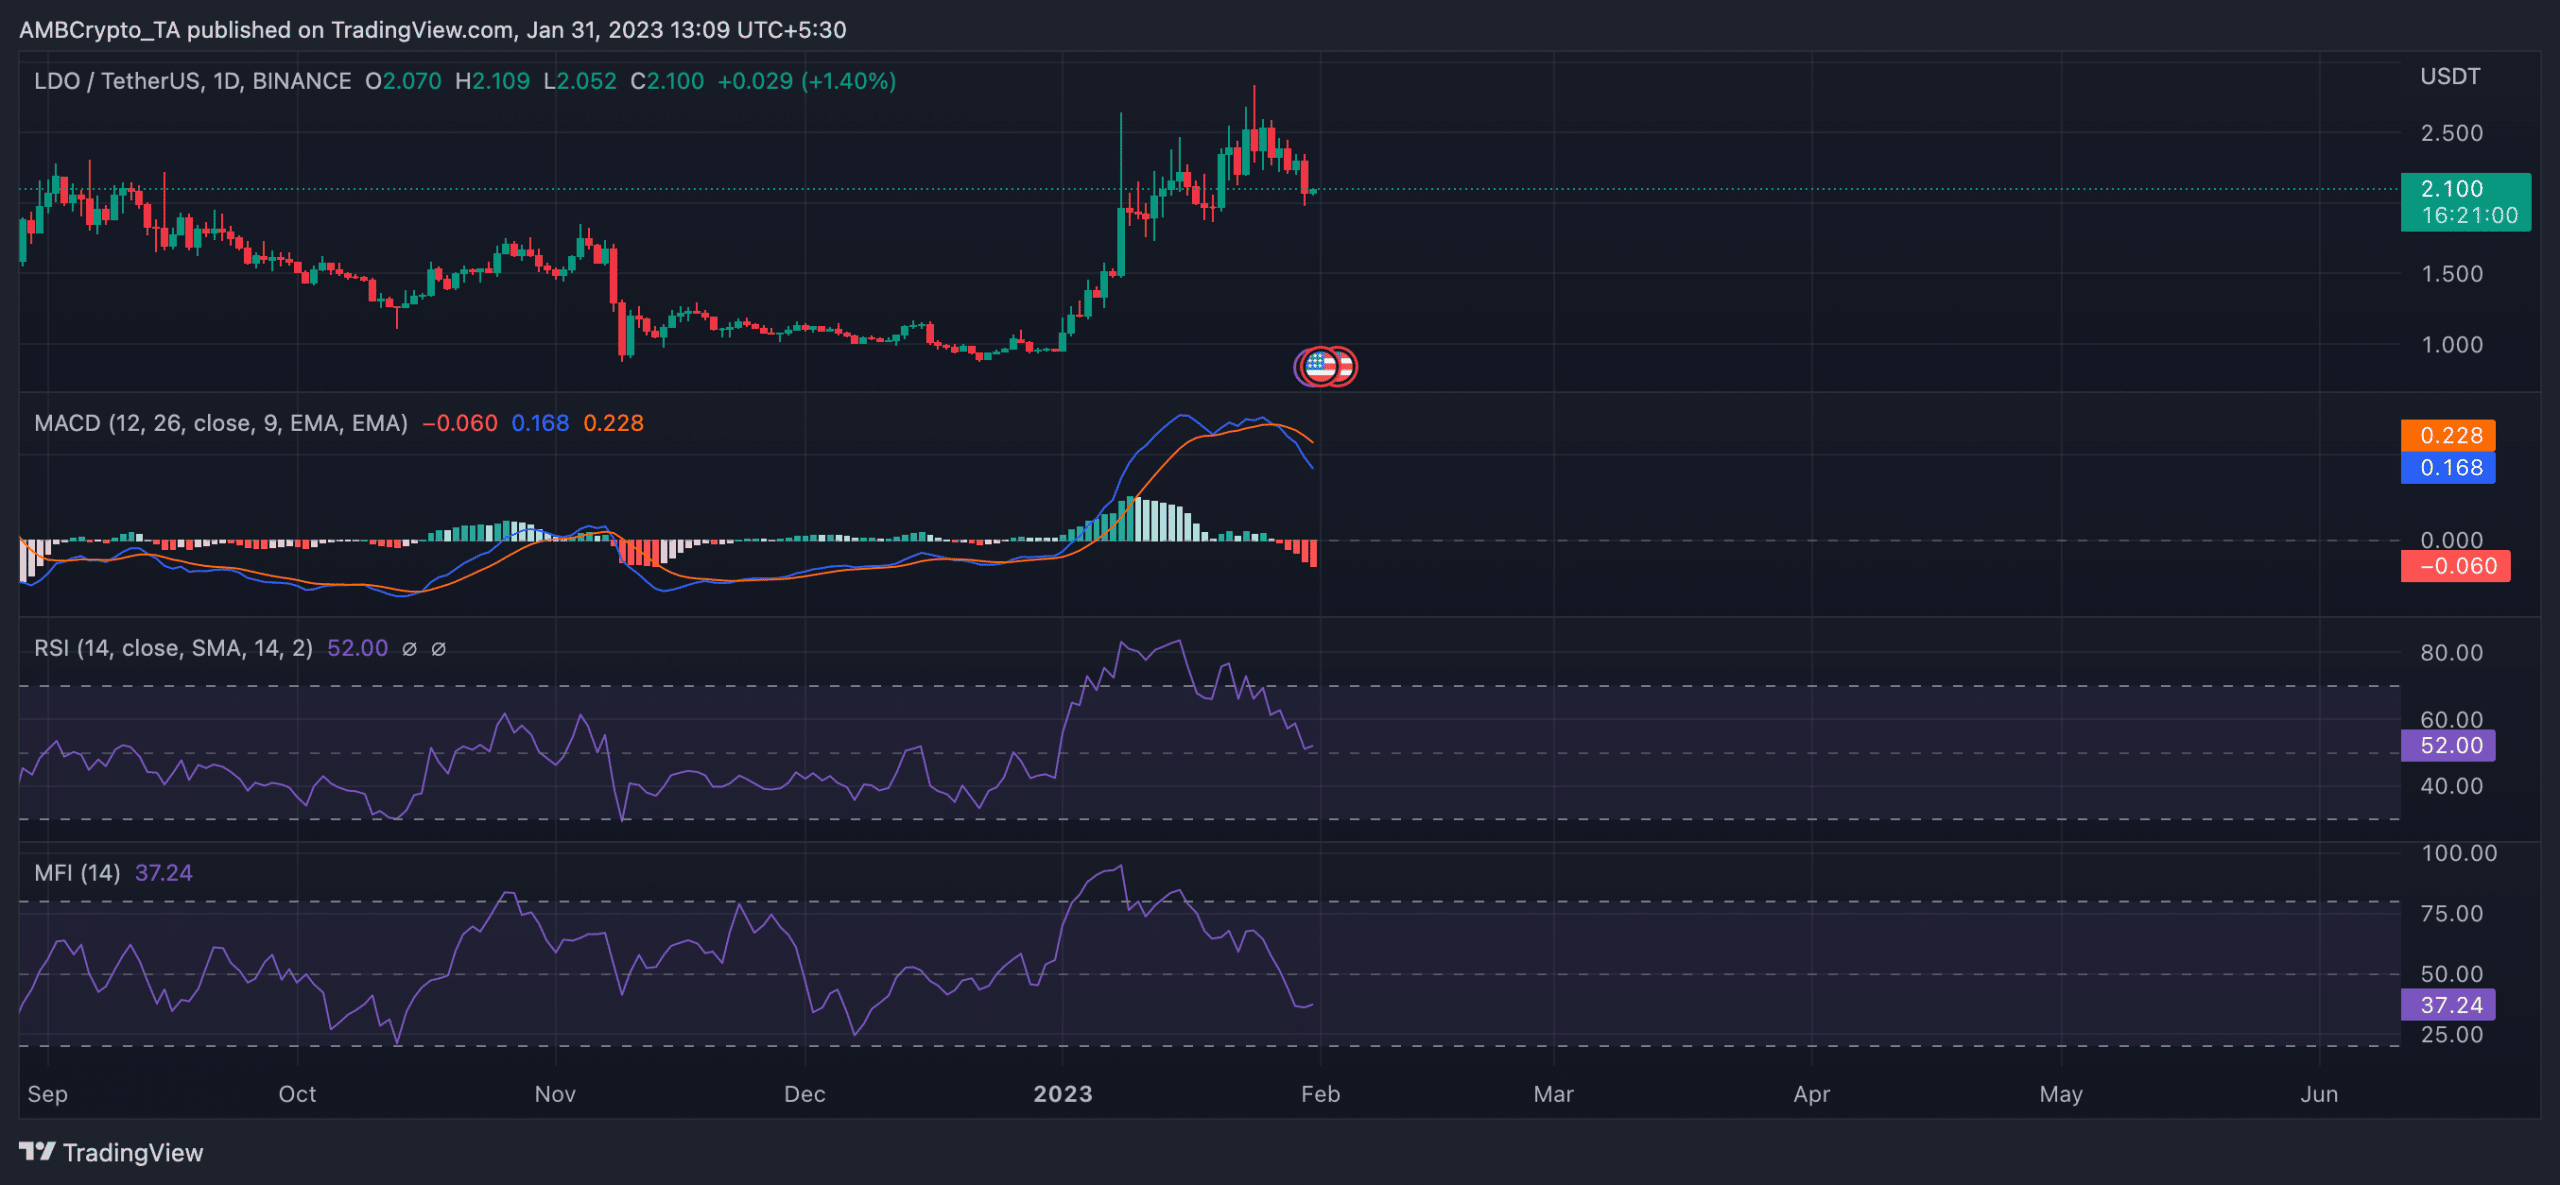
LDO’s price, which has risen 109% in the past month, could experience a downturn as analysis of its daily chart suggests the start of a bear market cycle.
An assessment of the alt’s moving average convergence/divergence (MACD) revealed an intersection of the MACD line with the trend line in a downtrend on 27 January. The indicator has since been marked by red histogram bars. In fact, LDO’s price has since dropped by 9%, per CoinMarketCap.
When an asset’s MACD line crosses the trend line in a downtrend, it often signals a potential trend reversal or a change in momentum. As a result, it is considered a bearish crossover, and traders often interpret it as a sell signal.
Is your portfolio green? Check out the Lido Profit Calculator
Also, key momentum indicators such as the Relative Strength Index (RSI) and the Money Flow Index (MFI) were in downtrends. For example, at press time, LDO’s RSI was 52, while its MFI had fallen below the neutral line to be pegged at 37.24.
These showed a persistent drop in LDO accumulation, usually followed by a price reversal.