Liquidity Provider lists top indicators for Technical Analysis
The reason behind trading has always been financial gain. Although many people are interested in trading these days, and its popularity is still rising, success in this industry requires careful study rather than luck.
Today, one of the most common methods of analyzing the market is called technical analysis. It first appeared in Amsterdam in the 17th century and was adopted by Japanese rice traders in the 18th century. Modern technologies have introduced several trading indicators to advance this type of approach, which are explained in this article.

Explanation of Technical Analysis
Technical indicators use previous information to analyze market activity, focusing on open interest, volume, and price. These tools do not address a company’s financials, such as earnings or profit margins, and concentrate exclusively on market trends. They are used by both long-term investors and active traders to evaluate short-term price changes and identify entry and exit points in the market.
Technical indicators turn trade information into visual data points by utilising mathematical algorithms and are usually displayed graphically next to the pricing charts. They help predict future price movements by revealing investor mood and market patterns.

What Are the Indicator Types?
There are five primary categories: Volume, Trend, Volatility, Momentum, and Breadth. Each has a unique function:
Momentum Indicators
In order to determine the strength of price fluctuations, traders employ momentum indicators, which quantify the speed of price change. In order to identify momentum rather than direction, they examine the rate at which stock prices fluctuate. Here are the examples:
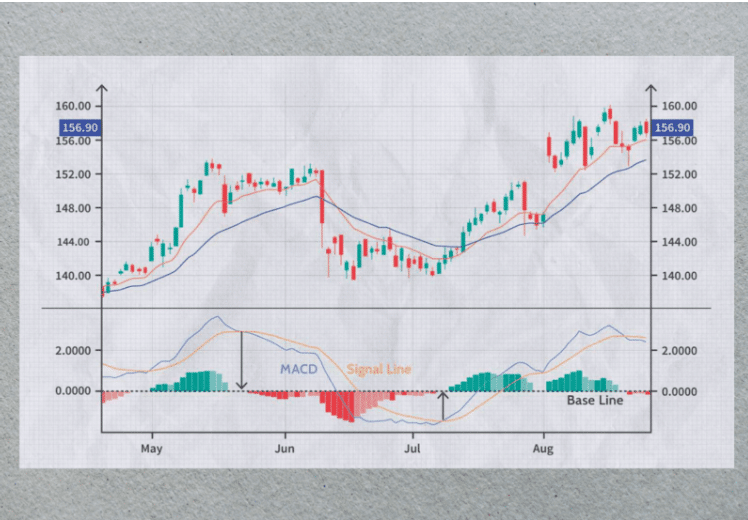
- Moving Average Convergence Divergence (MACD): Determines the correlation between two price moving averages.
- Relative Strength Index (RSI): Indicates overbought or oversold circumstances with a value between 0 and 100. Measures the pace and change of price movements.
- Average Directional Index (ADX): Evaluates a trend’s strength without pointing out its direction.
- Rate of Change (ROC): Displays the price change as a percentage, showing positive or negative momentum.
Volume Indicators
Volume indicators examine the quantity of stocks traded, providing insight into patterns and market sentiment. They forecast changes in pricing, providing early warnings regarding the continuation or reversal of trends. These include:
- Volume Price Trend Indicator (VPT): Shows price changes that are adjusted for volume by combining price and volume.
- Money Flow Index (MFI): This index integrates volume and price, similar to a volume-weighted RSI, to determine overbought or oversold situations.

Trend Indicators
These indicators are critical for determining and projecting market direction for trend trading methods. They provide signals for long or short positions and assist in the identification of upward or downward trends. Notable examples include:
- Moving Averages (MAs): To show trends, it smooths out price data. A lot of people use the SMA and EMA when trading.
- Supertrend: Shows the momentum and direction of the trend on price charts.
- Parabolic SAR: Helps with judgments about entry and exit by indicating possible reversal points.

Volatility Indicators
Indicators such as these measure market volatility, or the degree to which prices fluctuate. They are essential for knowing the dynamics of the market during periods of consolidation and ups or downs. Among the most notable indicators are:
- Bollinger Bands: Uses standard deviations, whereby variations in volatility are represented by expanding or contracting bands.
- Donchian Channel: Demonstrates volatility by measuring the gap between its upper and lower bands, which are based on price highs and lows.
- Average True Range (ATR): Determines market volatility by looking at an asset’s whole price range.

Breadth Indicators
By evaluating the quantity of stocks influencing a market movement, breadth indicators provide information about the strength of the market. They aid in determining the degree of market participation and the longevity of trends. Important metrics include:
- Periodic Highs and Lows: Keeps track of how many stocks make new highs or lows, which reveals market trends.
- Percent of Stocks Above Moving Average: Calculates the percentage of stocks that are above a given moving average to evaluate the mood of the market.
- Advance/Decline Line: Compares the quantity of rising vs falling equities to give a quick impression of the momentum of the market.

What to Consider While Using Indicators
It’s important for traders to keep in mind that technical indicators are instruments that assist trading strategies, not replace them. For a comprehensive picture of market conditions, strategies often combine a variety of indicators.
Diversification of indicator types is necessary to avoid multicollinearity or the overlapping of data that can confuse analysis. Utilizing many momentum indicators, for instance, could result in excessive data and less analytical clarity.
Traders are encouraged to combine indicators from several categories, such as a trend and momentum indicator, to create a balanced view of the situation. This combination increases the effectiveness and success rate of trading methods by enabling cross-validation of signals.
Final Thoughts
Trading indicators are helpful tools that provide information about trends and help with decision-making. But they’re not an absolute route to success. Traders need to include these indicators in a more comprehensive approach.
By combining different indicators, one may ensure a more complete picture of the market by avoiding an excessive reliance on a single form of data. Making educated decisions is a necessary part of trading, and using indicators wisely is one way to help you get where you want to go.