Litecoin [LTC] buyers are confident, but the $100-mark will…

Disclaimer: The information presented does not constitute financial, investment, trading, or other types of advice and is solely the writer’s opinion.
- The move above a lower timeframe resistance zone was an important development.
- A weak Bitcoin could wipe out Litecoin’s recent gains.
Litecoin [LTC] has stuttered on each approach of the $100 zone in the past three months. The bulls were in the process of driving another rally from $76 to $100, and on-chain metrics suggested that this time could be different.
Read Litecoin’s [LTC] Price Prediction 2023-24
Bitcoin retested $27.8k as resistance on 15 May and did not have a bullish bias on the higher timeframes. This could negatively impact Litecoin prices in case BTC prices fell.
The strong influx of demand at $80 drove an LTC move past $90
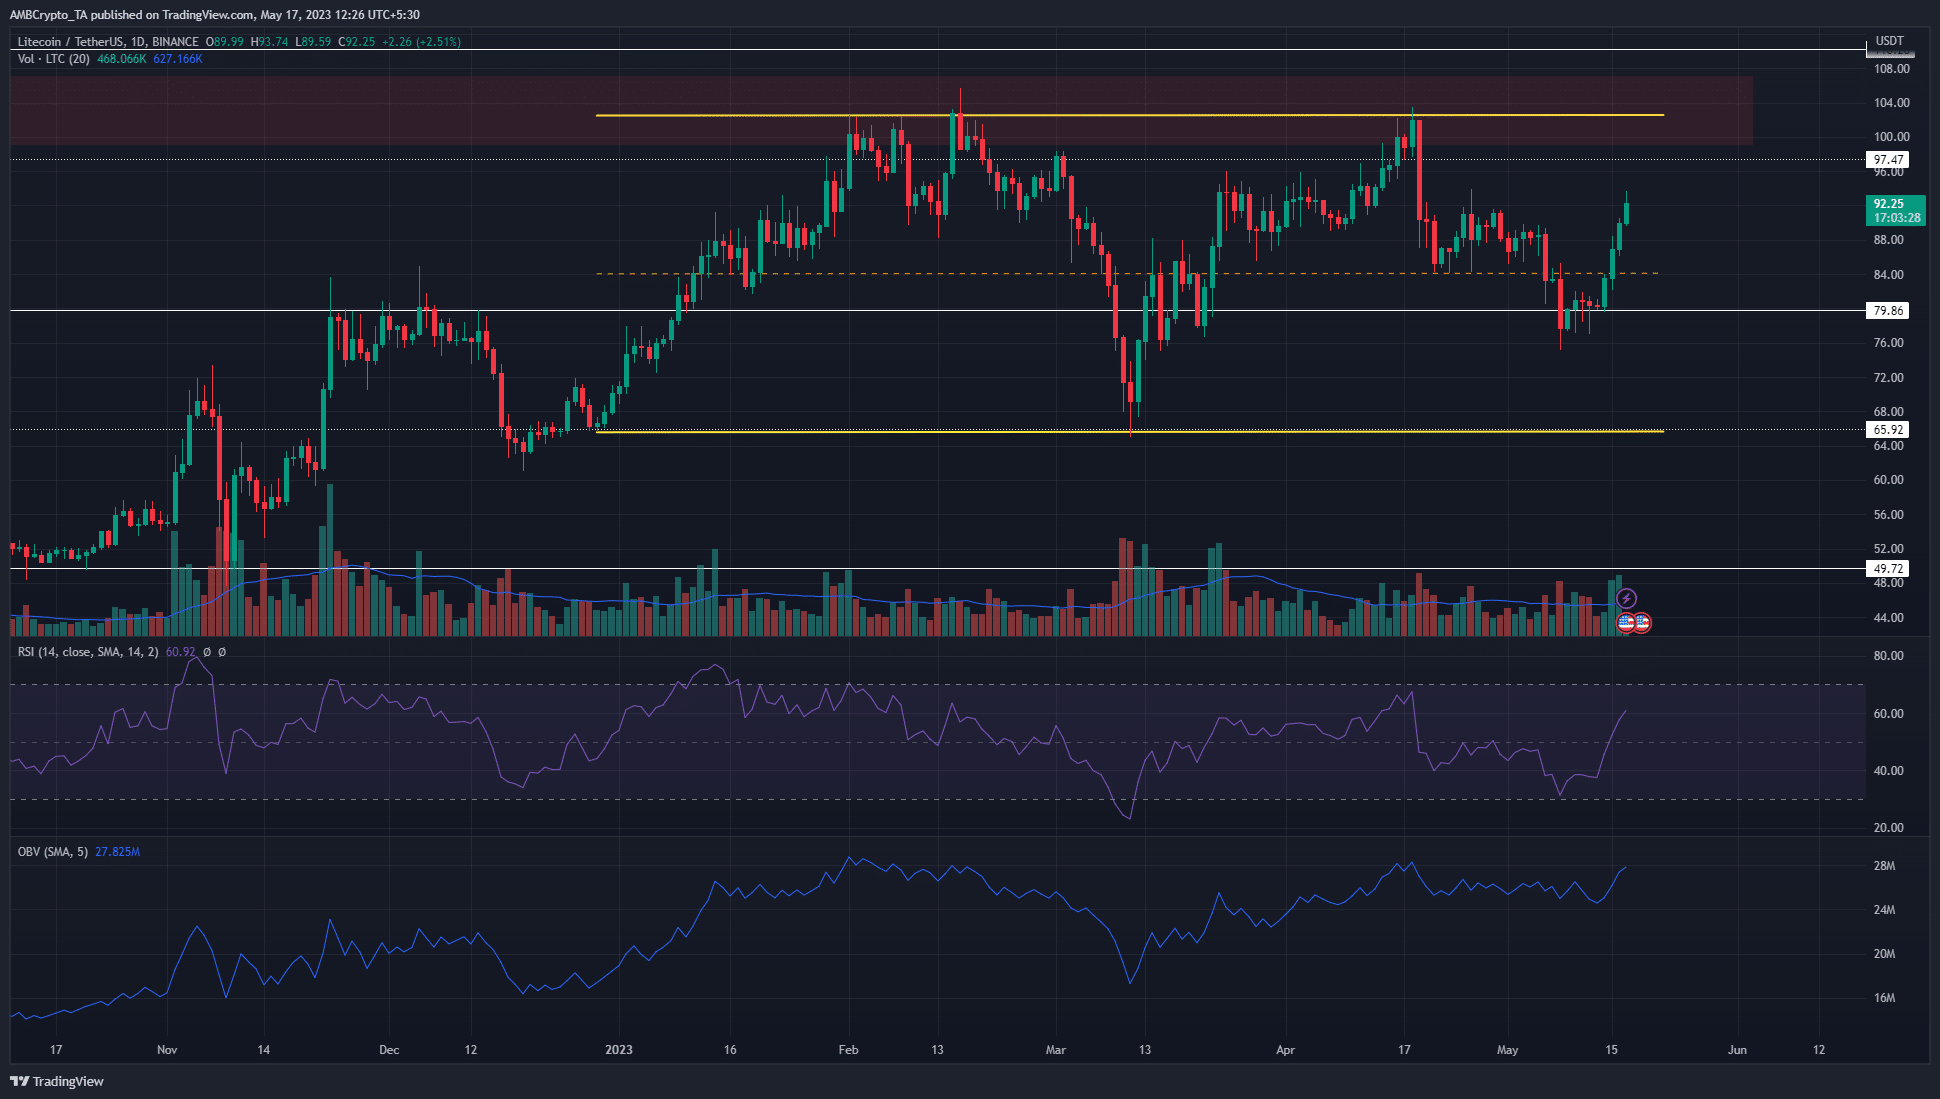
The daily timeframe chart showed a range formation (yellow) between $65.6 and $102.7. The mid-point at $84.2 served as support in mid-April before LTC fell as far south as $75.2.
Since then, and especially in the past four days, demand for Litecoin has been significant.
The buyers managed to drive prices upward by 17.8% measured from Sunday’s swing low. The RSI jumped back above neutral 50 to show strong bullish momentum. However, the OBV was yet to break the local resistance level.
Above the range highs sat a bearish order block on the daily timeframe from 4 May 2022. The bulls tried to breach this area in both February and April but were rebuffed on both occasions.
An encouraging fact was that April’s rejection saw a higher low form at $75.2, instead of a move back to the range lows.
A look at the 4-hour charts showed that the $88-$91.5 area had strong resistance, but LTC managed to move past this zone.
This supported the idea that a move to $100-$102 was possible, but it remained likely that Litecoin would be unable to rally above $105 unless Bitcoin saw sentiment shift to bullish as well.
Realistic or not, here’s LTC’s market cap in BTC terms
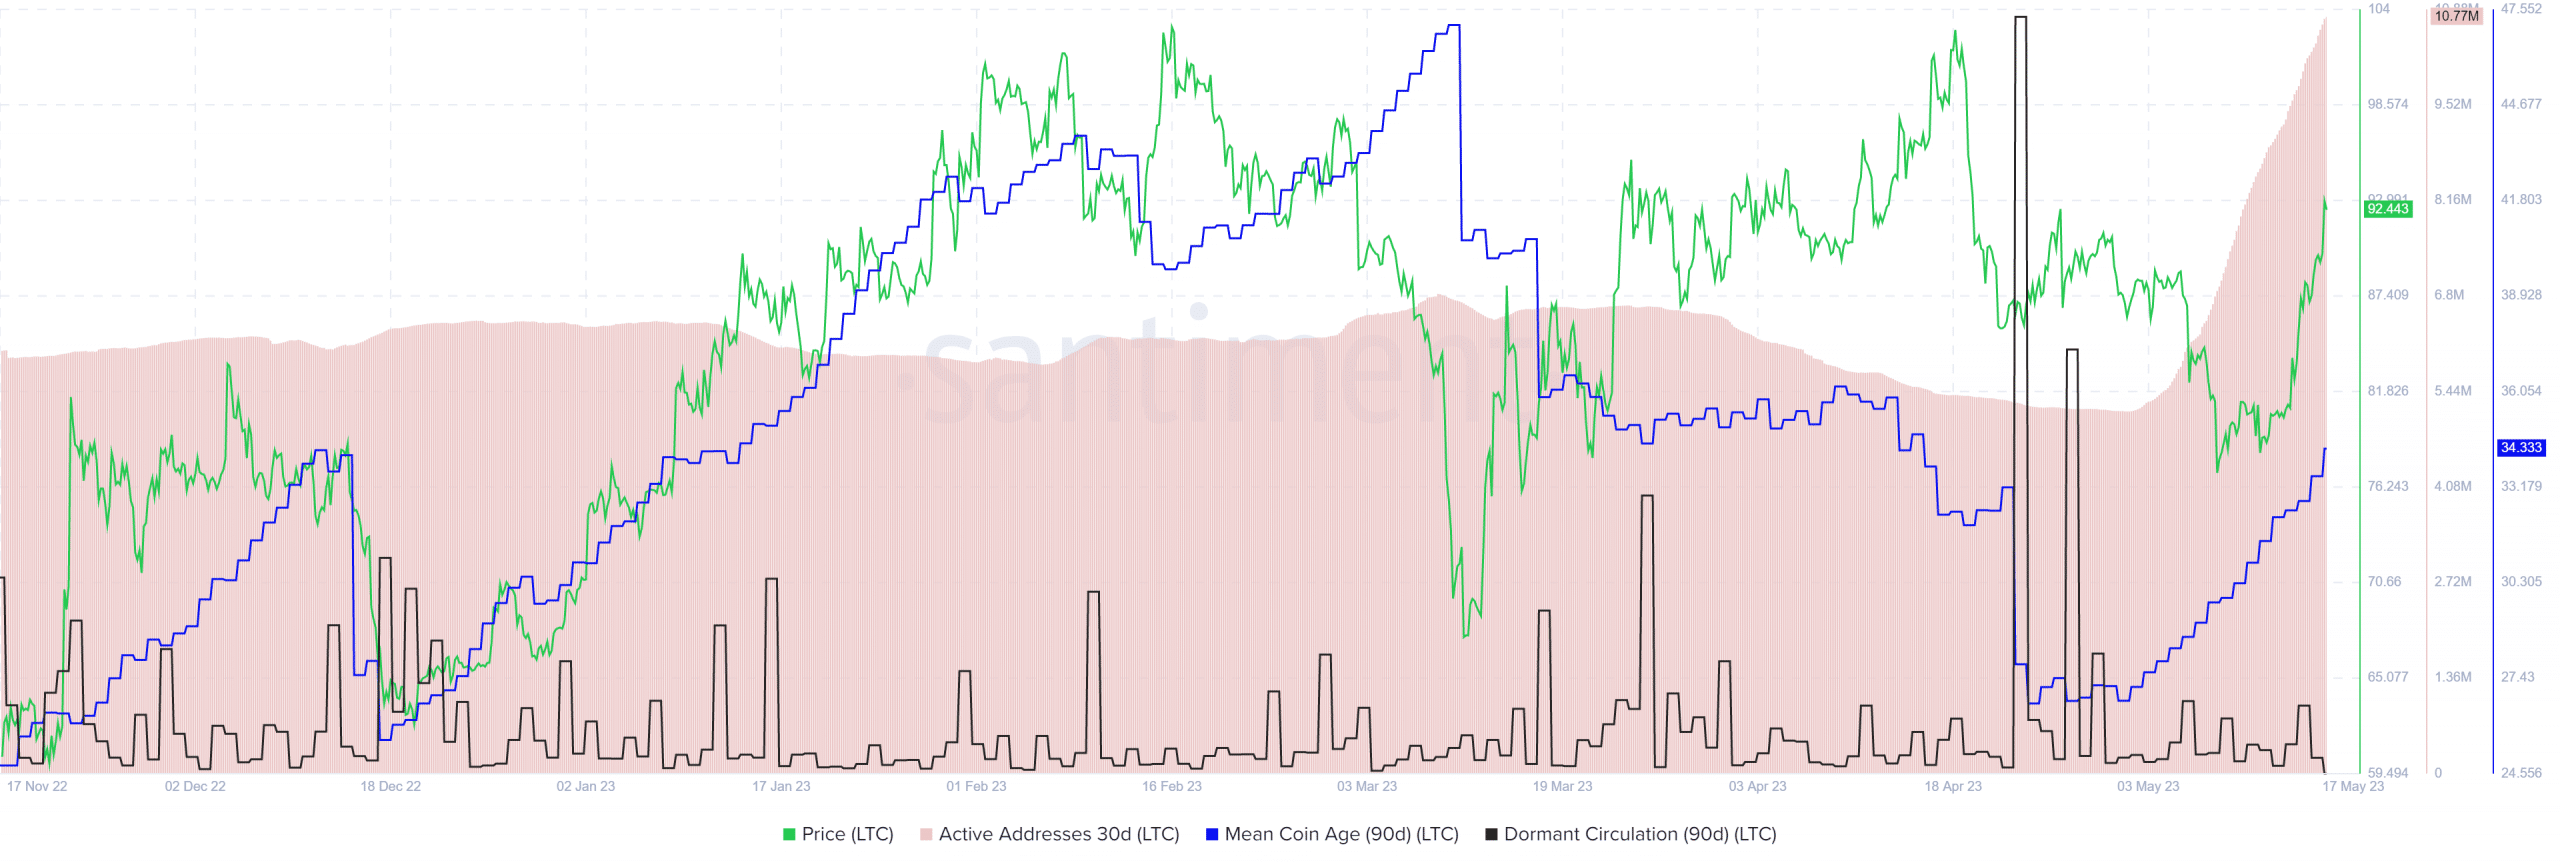
On-chain metrics showed an accumulation phase over the past two weeks

Source: Santiment
Santiment data showed the mean coin age (90-day) was rising since 2 May. This was indicative of accumulation across the network as it showed decreased token movement between addresses, and thereby a reduction in selling pressure.
The dormant circulation was also subdued in this period, showing a lack of intense selling. The sharp rise in active addresses pointed toward the possibility of increased demand.


