Litecoin, Fantom, ETC Price Analysis: 14 February

With Bitcoin re-entering the $42,000-zone, Fantom and Ethereum Classic flashed bearish near-term technicals. The former lost the crucial $1.9 level while the latter eyed to test the $30-support. Furthermore, Litecoin consolidated between the $128- $123 range with a slight bearish edge.
Litecoin (LTC)
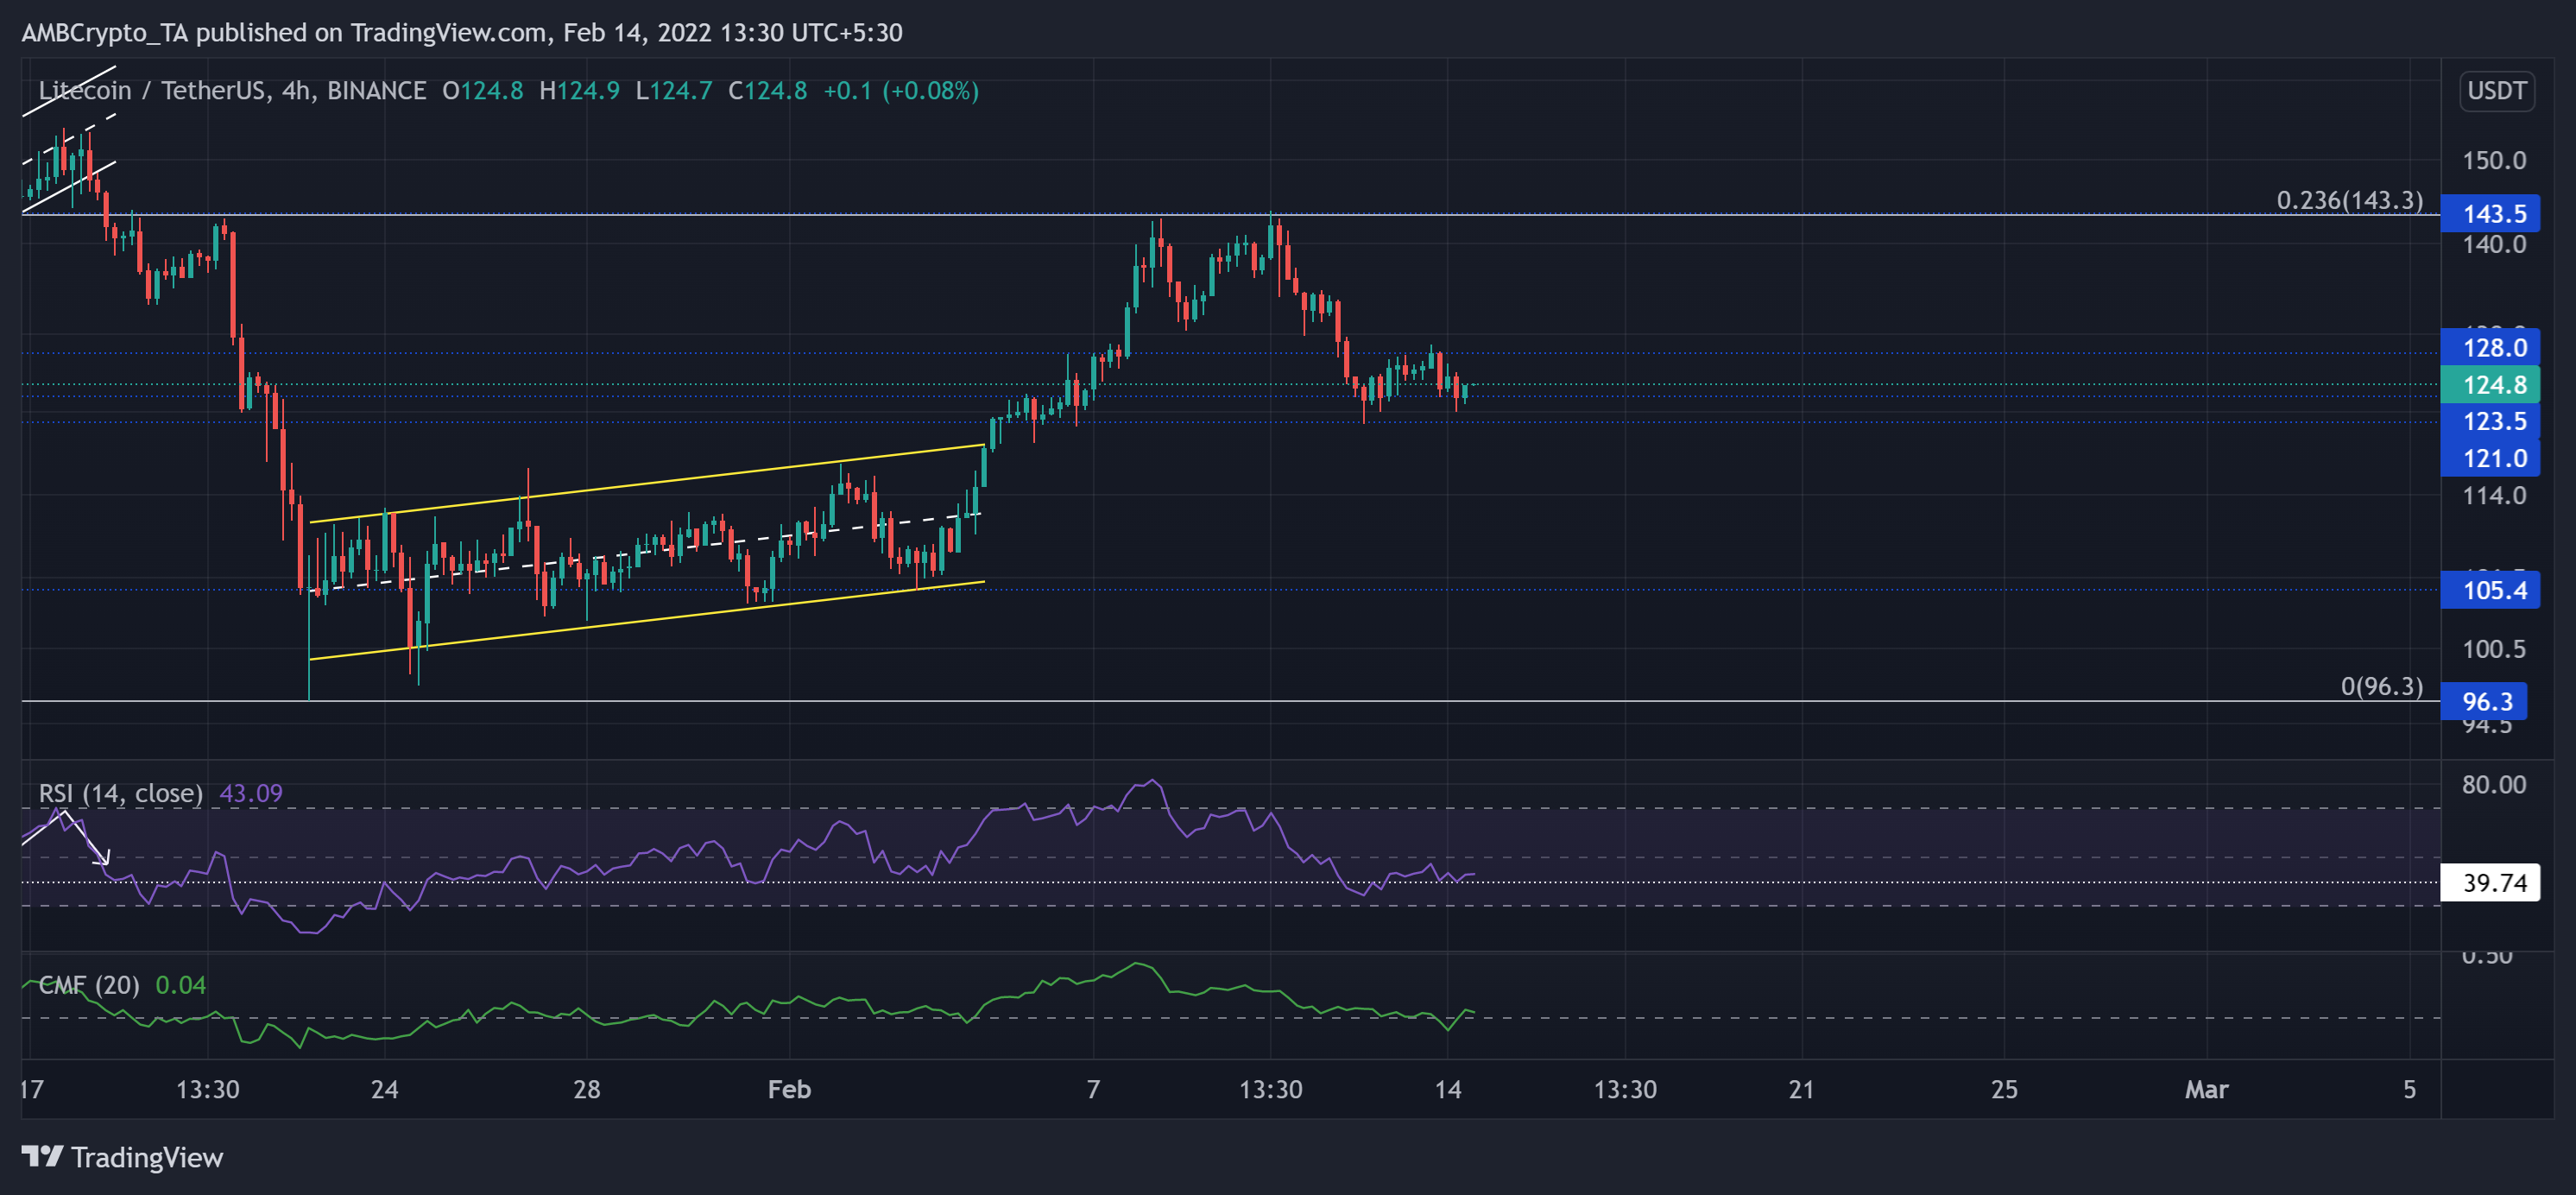
Litecoin’s (LTC) previous rally saw a 49.3% ROI from its 13-month low on 22 January that halted at the $143-mark. This level was near the 23.6% Fibonacci resistance.
Having an over 90% correlation with Bitcoin, LTC followed the king coin’s trajectory over the last few days. It lost over 13% of its value in just the last four days. Now, the immediate resistance stood near $128 while the bears tested the $123-support multiple times in the past two days.
At press time, LTC traded at $124.8. The RSI crossed the 39-mark resistance but continued to sway below the equilibrium. It needed to find a close above its midline to reignite the recovery chances. Nevertheless, the CMF closed above the zero-line and depicted a bullish edge.
Fantom (FTM)
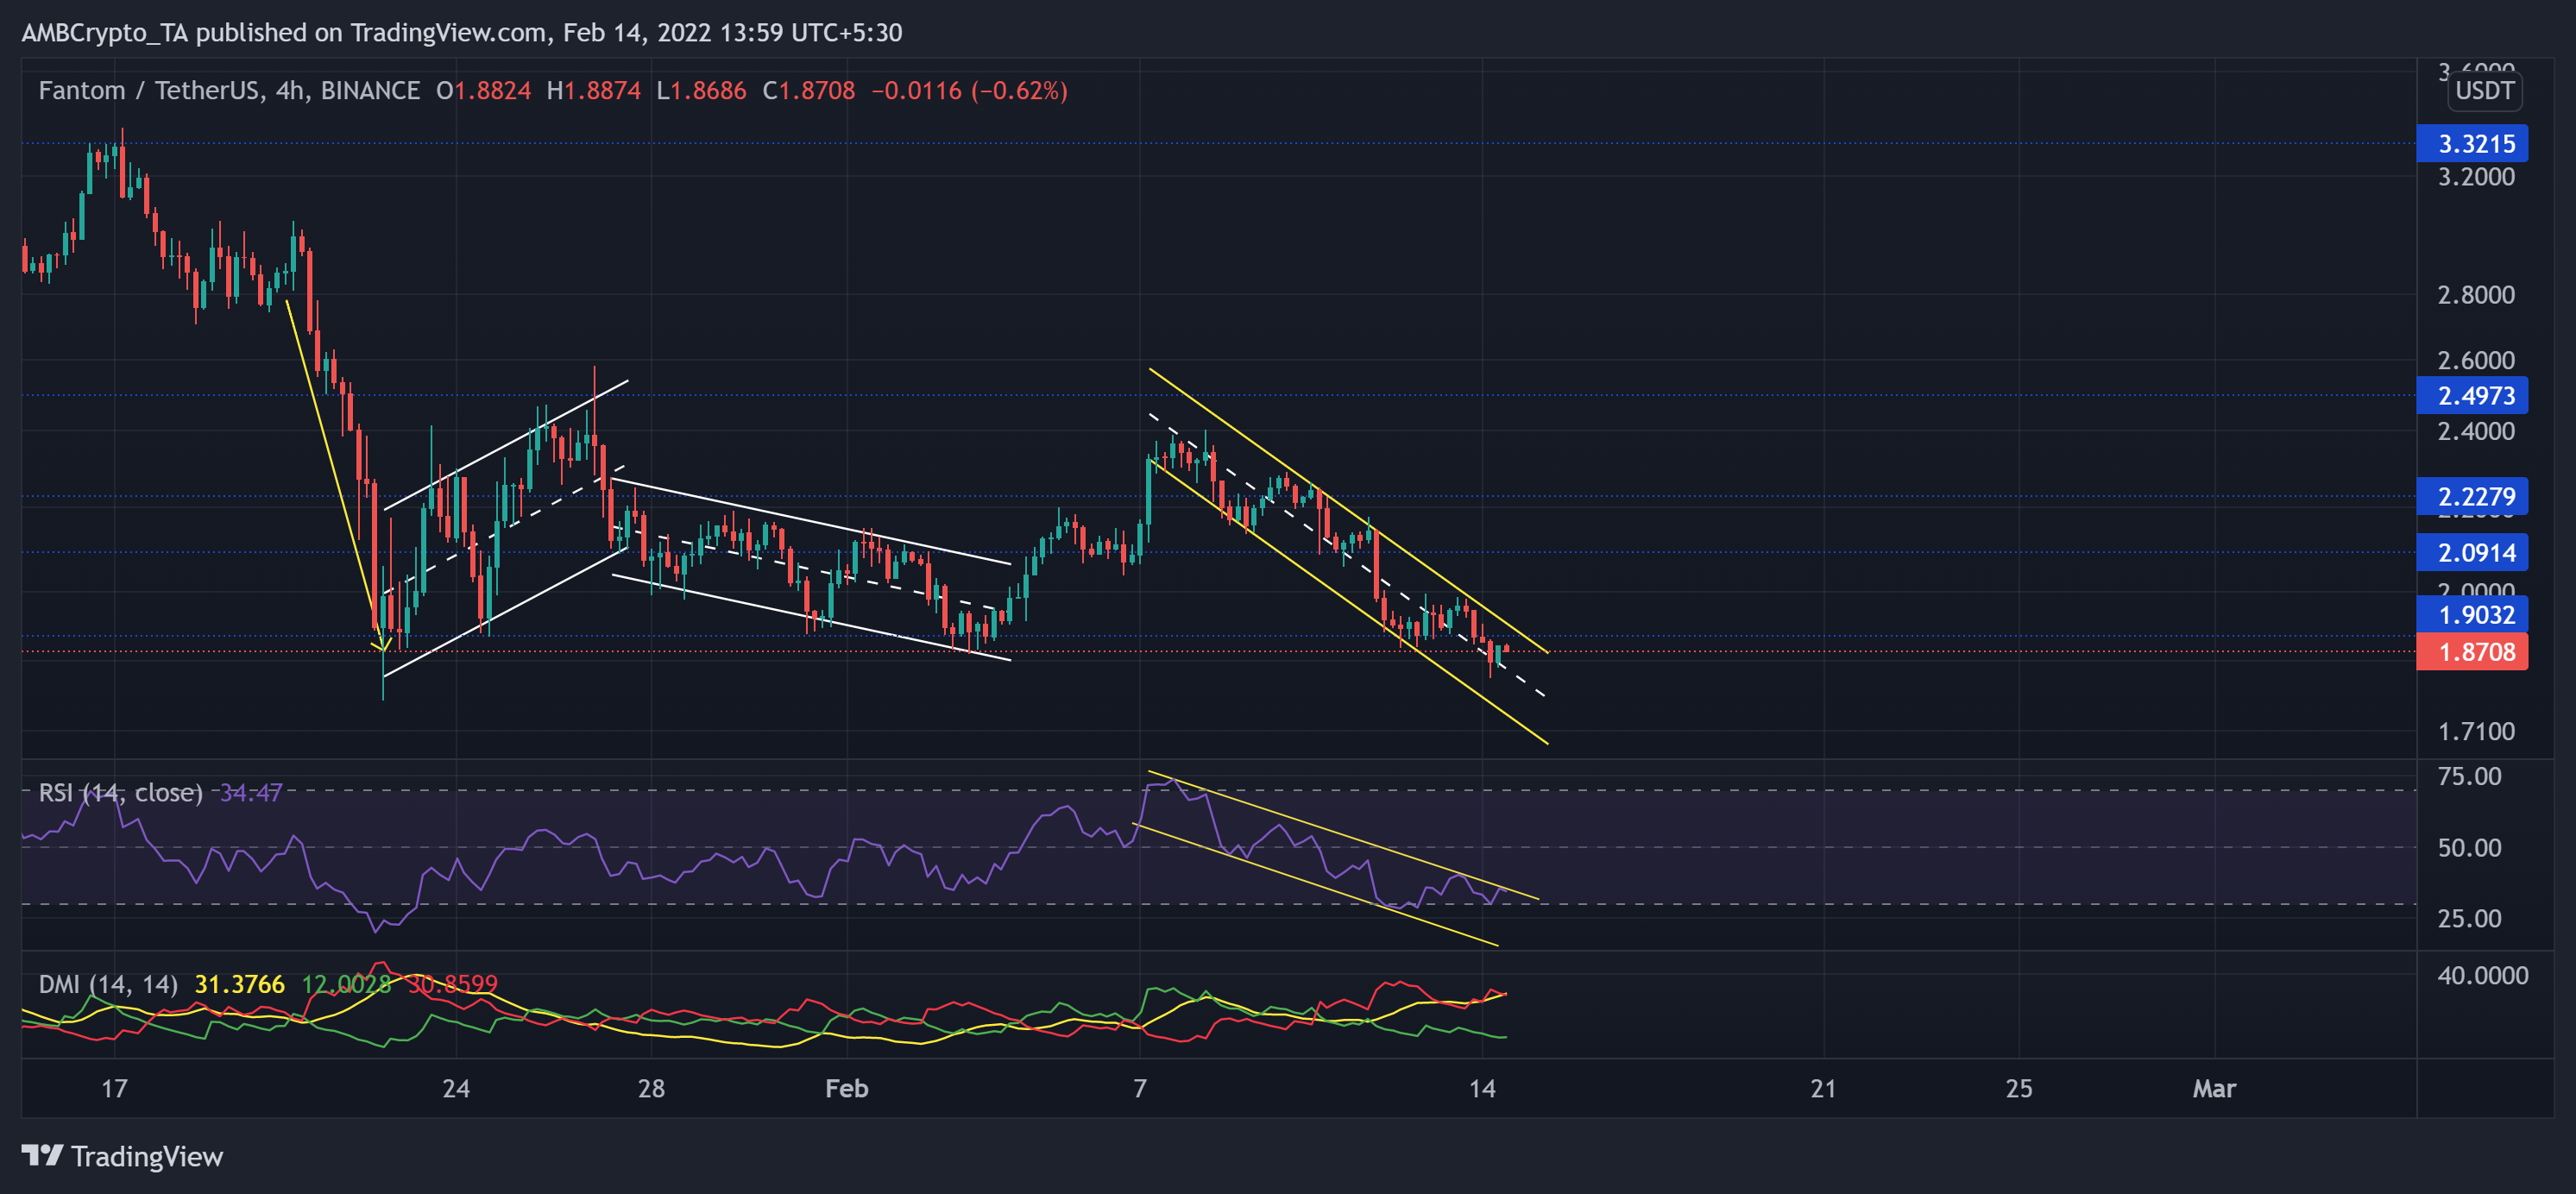
Since FTM reversed from the $3.32-level, the bears have exerted constant pressure. Consequently, it hit its one-month low on 24 January.
Since then, the alt was rangebound between the $2.5 and $1.9-mark until the recent retracement led the bears to breach the $1.9-mark. FTM registered an over 22% loss in just the last six days. Now, it becomes vital for the buyers to reclaim the aforestated mark that coincided with the upper trendline of the down-channel.
At press time, FTM traded at $1.87. The RSI saw a rapid downfall towards the oversold region. Now, it found support at the 30-mark while facing a hurdle at its upper trendline. Moreover, the DMI skewed in favor of sellers and reaffirmed the previous analysis.
Ethereum Classic (ETC)
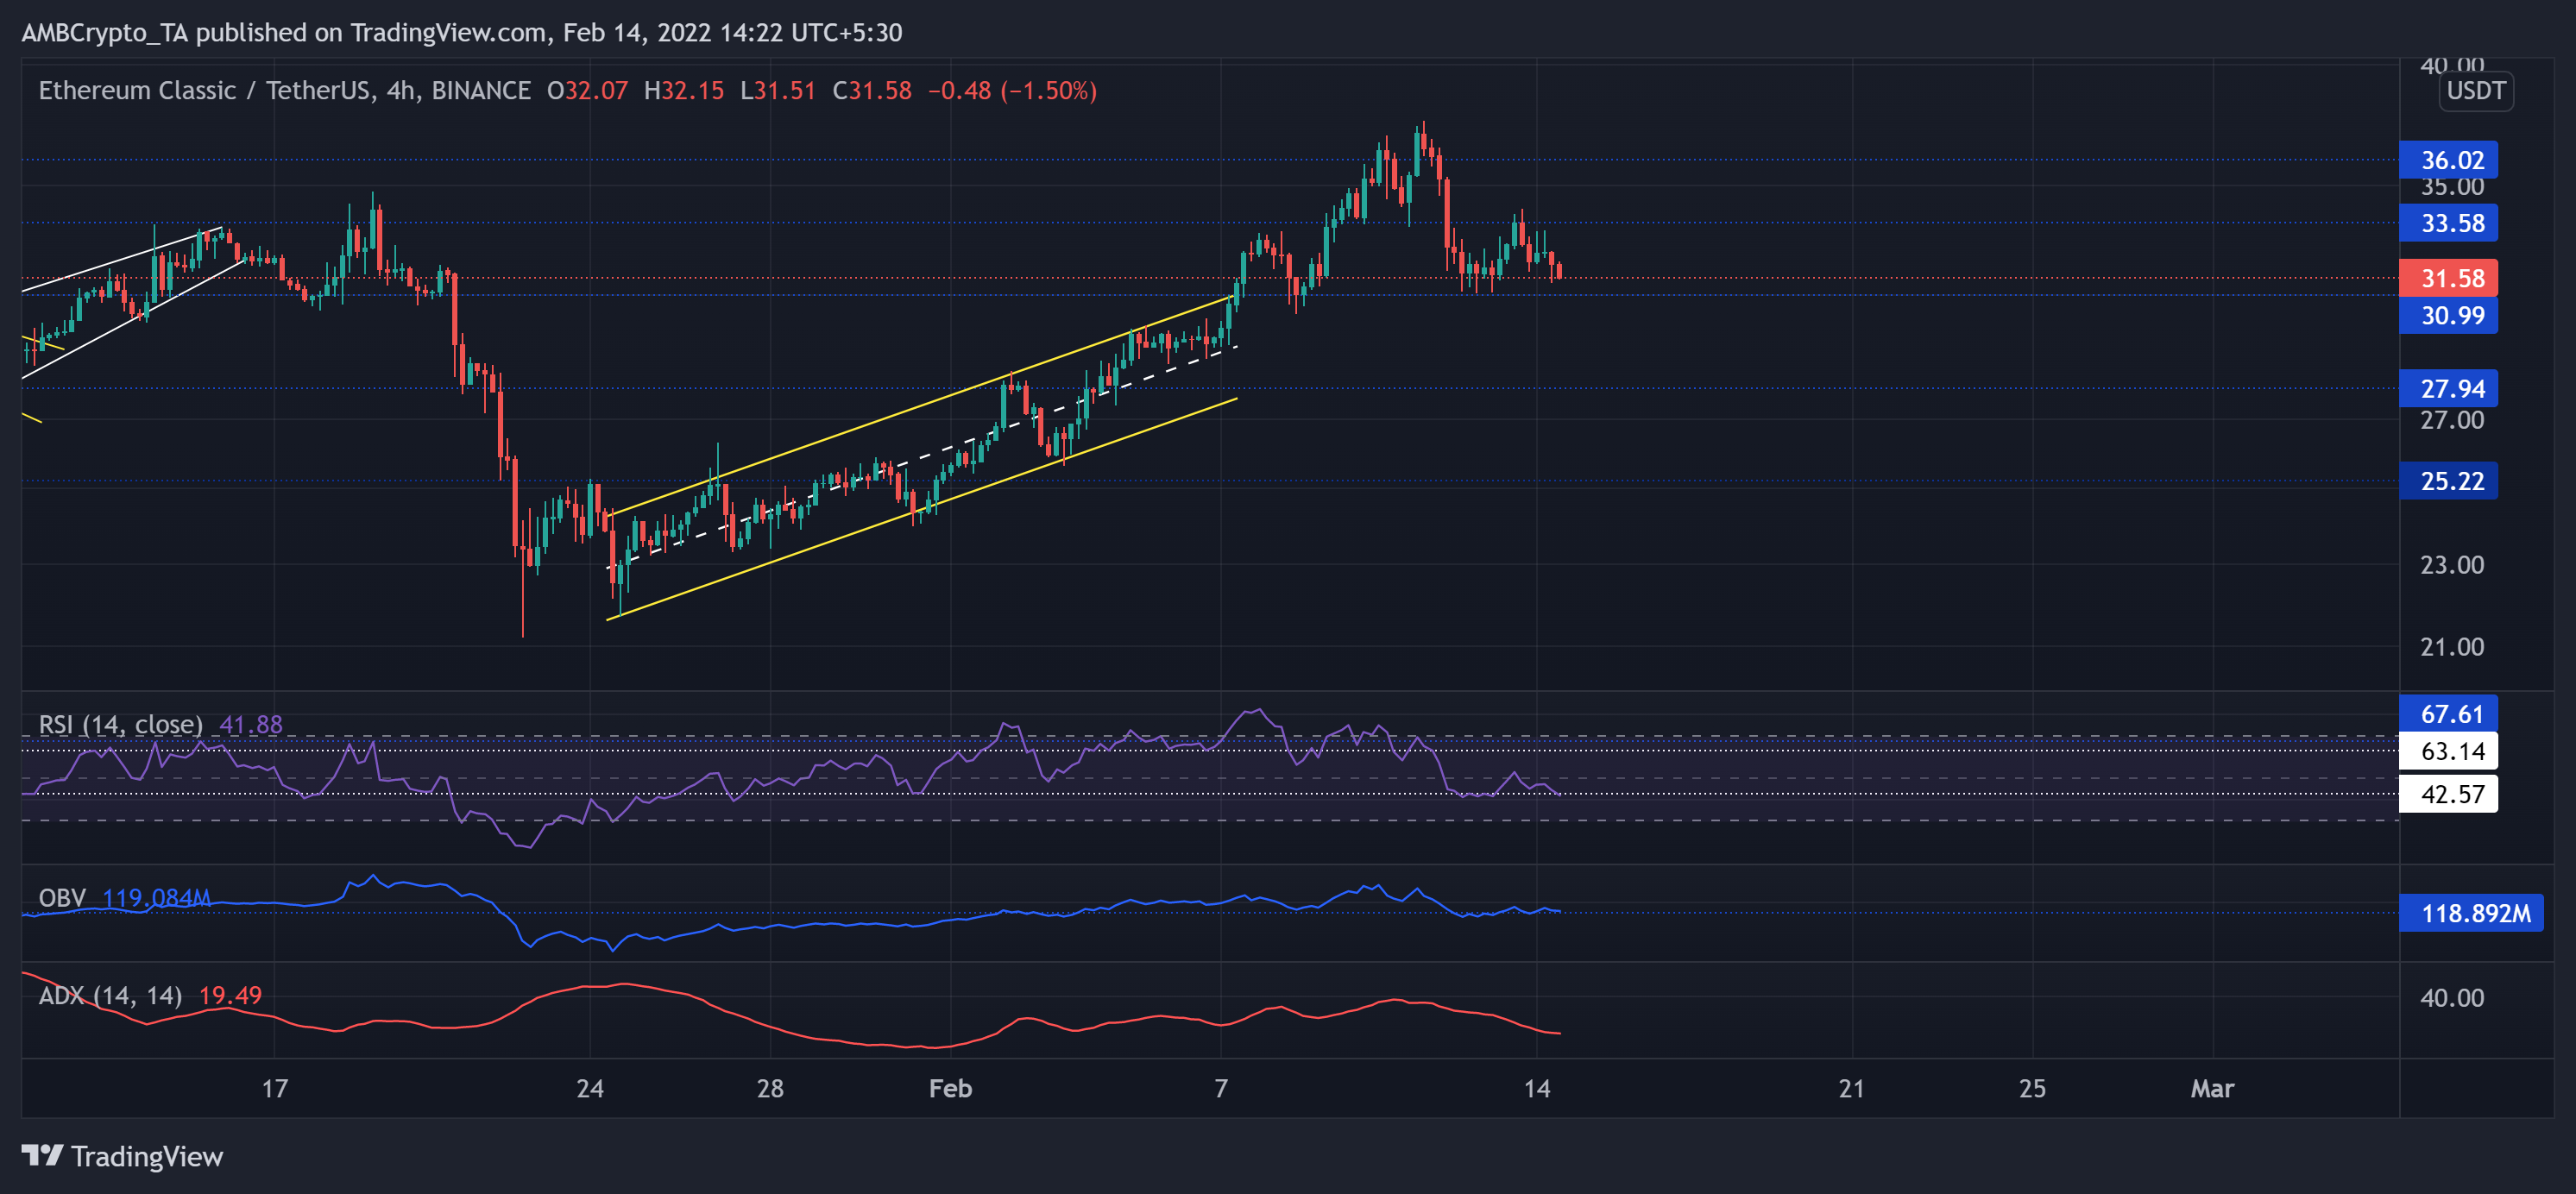
As the sell-off phase initiated, ETC lost 39.98% (from 19 January high) and touched its nine-month low on 22 January. However, since then, the altcoin has registered a staggering 76.2% ROI and poked above the $36-resistance.
Since then, it saw a 16% pullback in the last three days while the bears flipped the $33-mark from support to immediate resistance. Well, the immediate retest level for bears stood near $30.
At press time, ETC traded at $31.58. Over the past 24-hours, the RSI reversed from the midline and tested the 42-mark. It stood weak and displayed no revival signs in the near term. Further, the OBV stood at a level that corresponded with lower price points in the past. However, the ADX (directional trend) was extremely weak for ETC.


