Litecoin [LTC]: Bears seize control with break of trendline support
Another major downtrend could be likely for LTC after break of key support confluence.

Disclaimer: The information presented does not constitute financial, investment, trading, or other types of advice and is solely the writer’s opinion.
- Bears halted bullish momentum with a break of key trendline support.
- Shorts held a 51.4% advantage on the long/short ratio.
Litecoin’s [LTC] month-long bullish streak was halted by bears over the past 48 hours with a break of the trendline support. This saw LTC close under the $80 psychological level with price trading at $77, as of press time.
Read Litecoin’s [LTC] Price Prediction 2023-24
With Bitcoin [BTC] ranging between the $25.6k and $26.2k levels, LTC could experience further downside in the coming days.
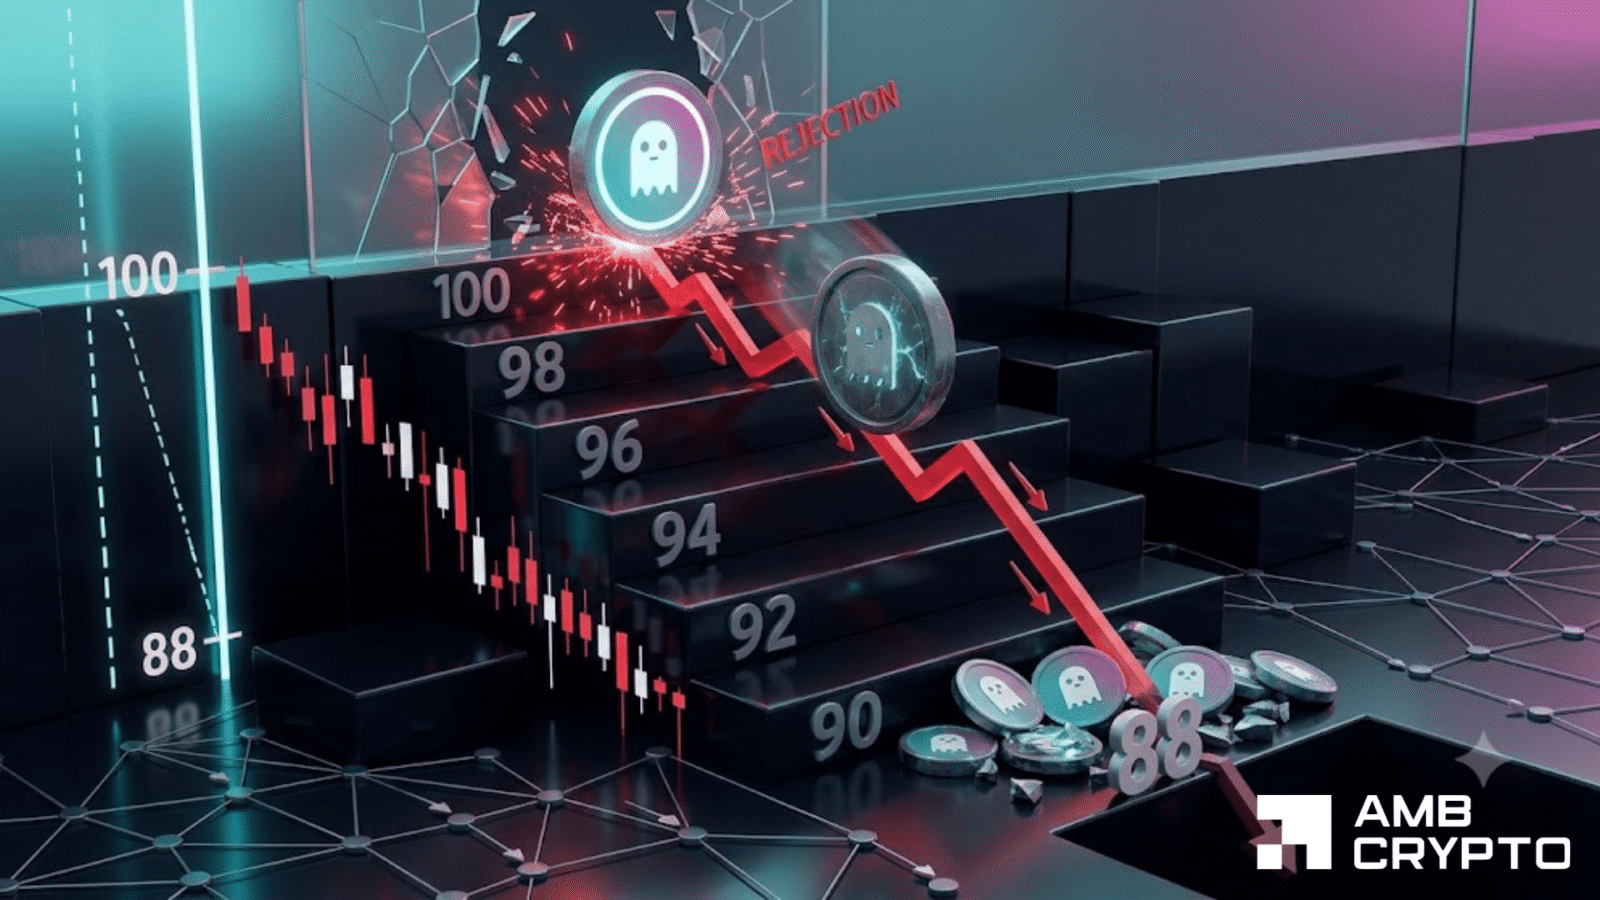
Price rejection at $97 resistance level ushered intense selling wave

Examining Litecoin’s price action in the 12-hour timeframe revealed an interesting price war between bulls and bears. Bulls held the upper hand from 14 May using the $80 psychological level to rally. The significant buying pressure saw bulls claim the minor resistance at $85 with successive bullish candles.
However, the $97 resistance level proved to be a major stumbling block. Price was swiftly rejected at the level with bears immediately seizing control. Three bearish candles in a row saw the price quickly drop to the $85 support level. A brief bullish rebound from the $85 support level was again curtailed by bears. Sustained selling pressure on 10 June saw bears claim the $85 and $80 support levels, breaking the lower high of the bullish uptrend and smashing the support confluence at $80.
The on-chart indicators highlighted the bearish dominance. The Relative Strength Index (RSI) dropped into the oversold zone and stood at 28, as of the time of writing. The Moving Average Convergence Divergence (MACD) posted a bearish crossover on 5 June and continued to decline below the zero mark with multiple red bars.
This implied that further bearish activity could see sellers target the $72 and $65 support levels. On the other hand, bulls could look to rebound with a rally to the $80 key level.
Shorting positions by bearish speculators made sentiment clear

The liquidation heatmap from Coinglass showed $1.28 million of long positions were liquidated over the past 24 hours, compared to $511.67k in short positions. This highlighted the bearish upper hand in the futures market.
How much are 1,10,100 LTCs worth today?
Shorts also held a 51.4% advantage on the long/short ratio. This reiterated the bearish dominance and hinted at an increased possibility of more selling pressure for LTC in the mid/long term.