Litecoin [LTC]: The when and how of traders capitalizing on this opportunity

Disclaimer: The findings of the following analysis are the sole opinions of the writer and should not be considered investment advice
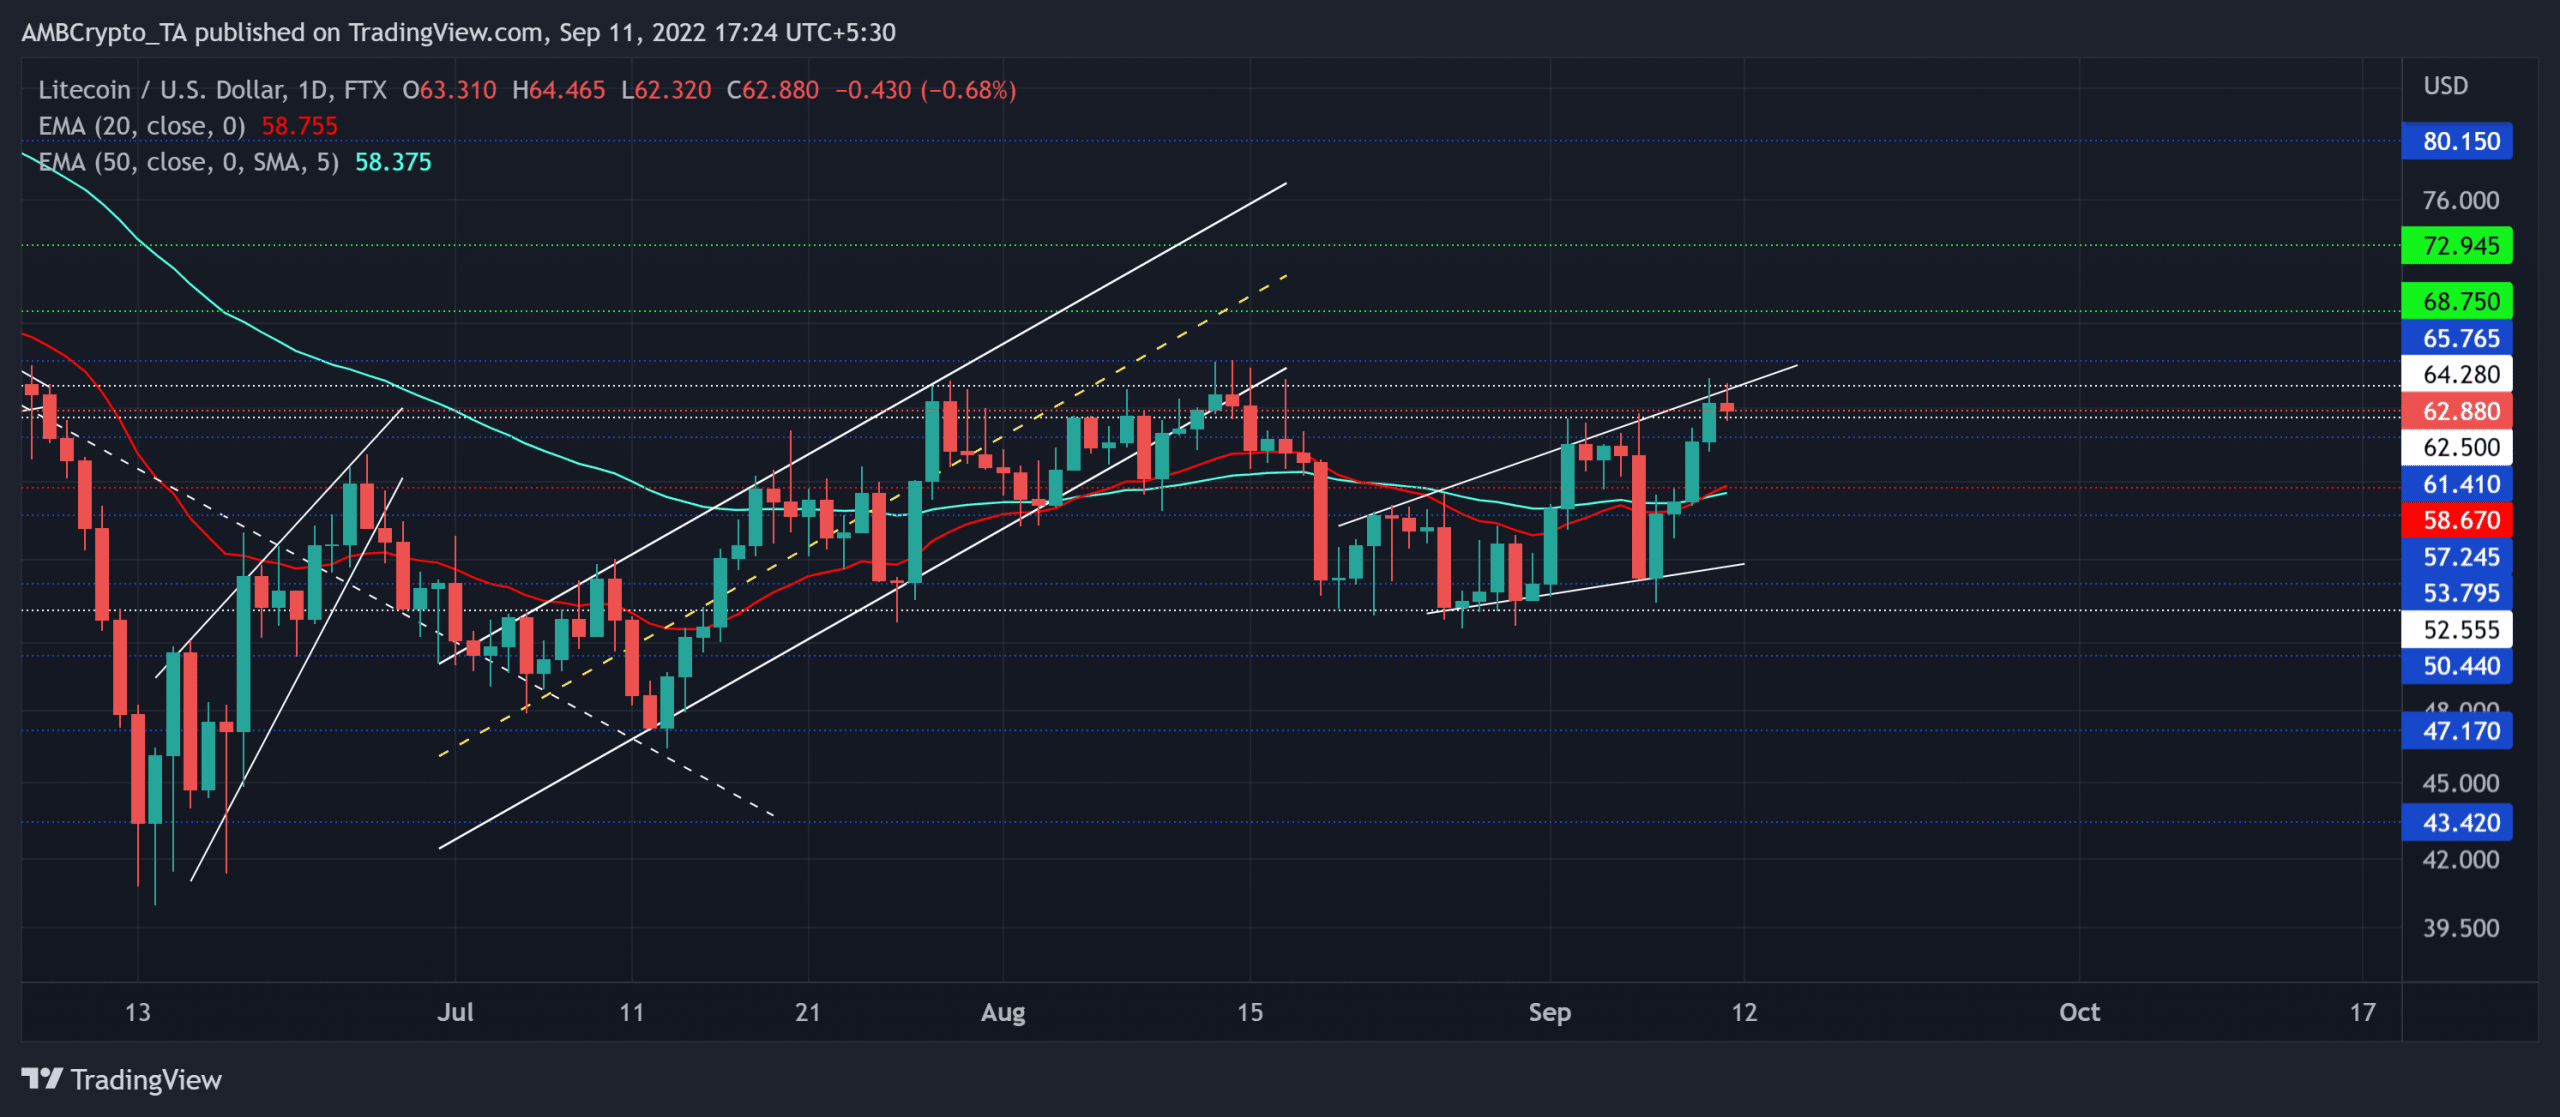
Litecoin’s [LTC] recent rebound from the $52-baseline has well-positioned the coin to test the resistance barrier in the $62-$64 range. The rebound spurred near-term buying hopes. However, the resistance range has undermined the bullish efforts for the last three months while preventing the streak of green candles.
Meanwhile, the altcoin registered a reversal pattern on its daily chart. A sustained rejection of higher prices near the $$62-64 range can inflict a near-term pullback. At press time, LTC was trading at $62.88 on the charts.
LTC Daily Chart

Source: TradingView, LTC/USD
LTC’s buying resurgence propelled steeply higher highs alongside slightly higher troughs. This trajectory took shape of an ascending broadening wedge in this timeframe. This pattern is considered to be rather bearish as it registers a downward breakout more often than not.
After a solid 20% growth from the lower boundary of the pattern, LTC saw reversal signs from the $64-region. These gains aided the coin in closing above its 20 EMA (red) and the 50 EMA (cyan).
While these EMAs undertook a bullish crossover, they could offer rebounding tendencies for a potential pullback.
A decline below the $62-level can help sellers provoke a pulldown towards the $58.6-level near the press time 20 EMA. Any close below this support could expose the alt to an extended decline. In this case, LTC could head towards the $53-zone before the bulls step in to boost the buying pressure.
Any jump beyond the $64-level would confirm a bearish invalidation and hint at buying signals.
Rationale

Source: TradingView, LTC/USD
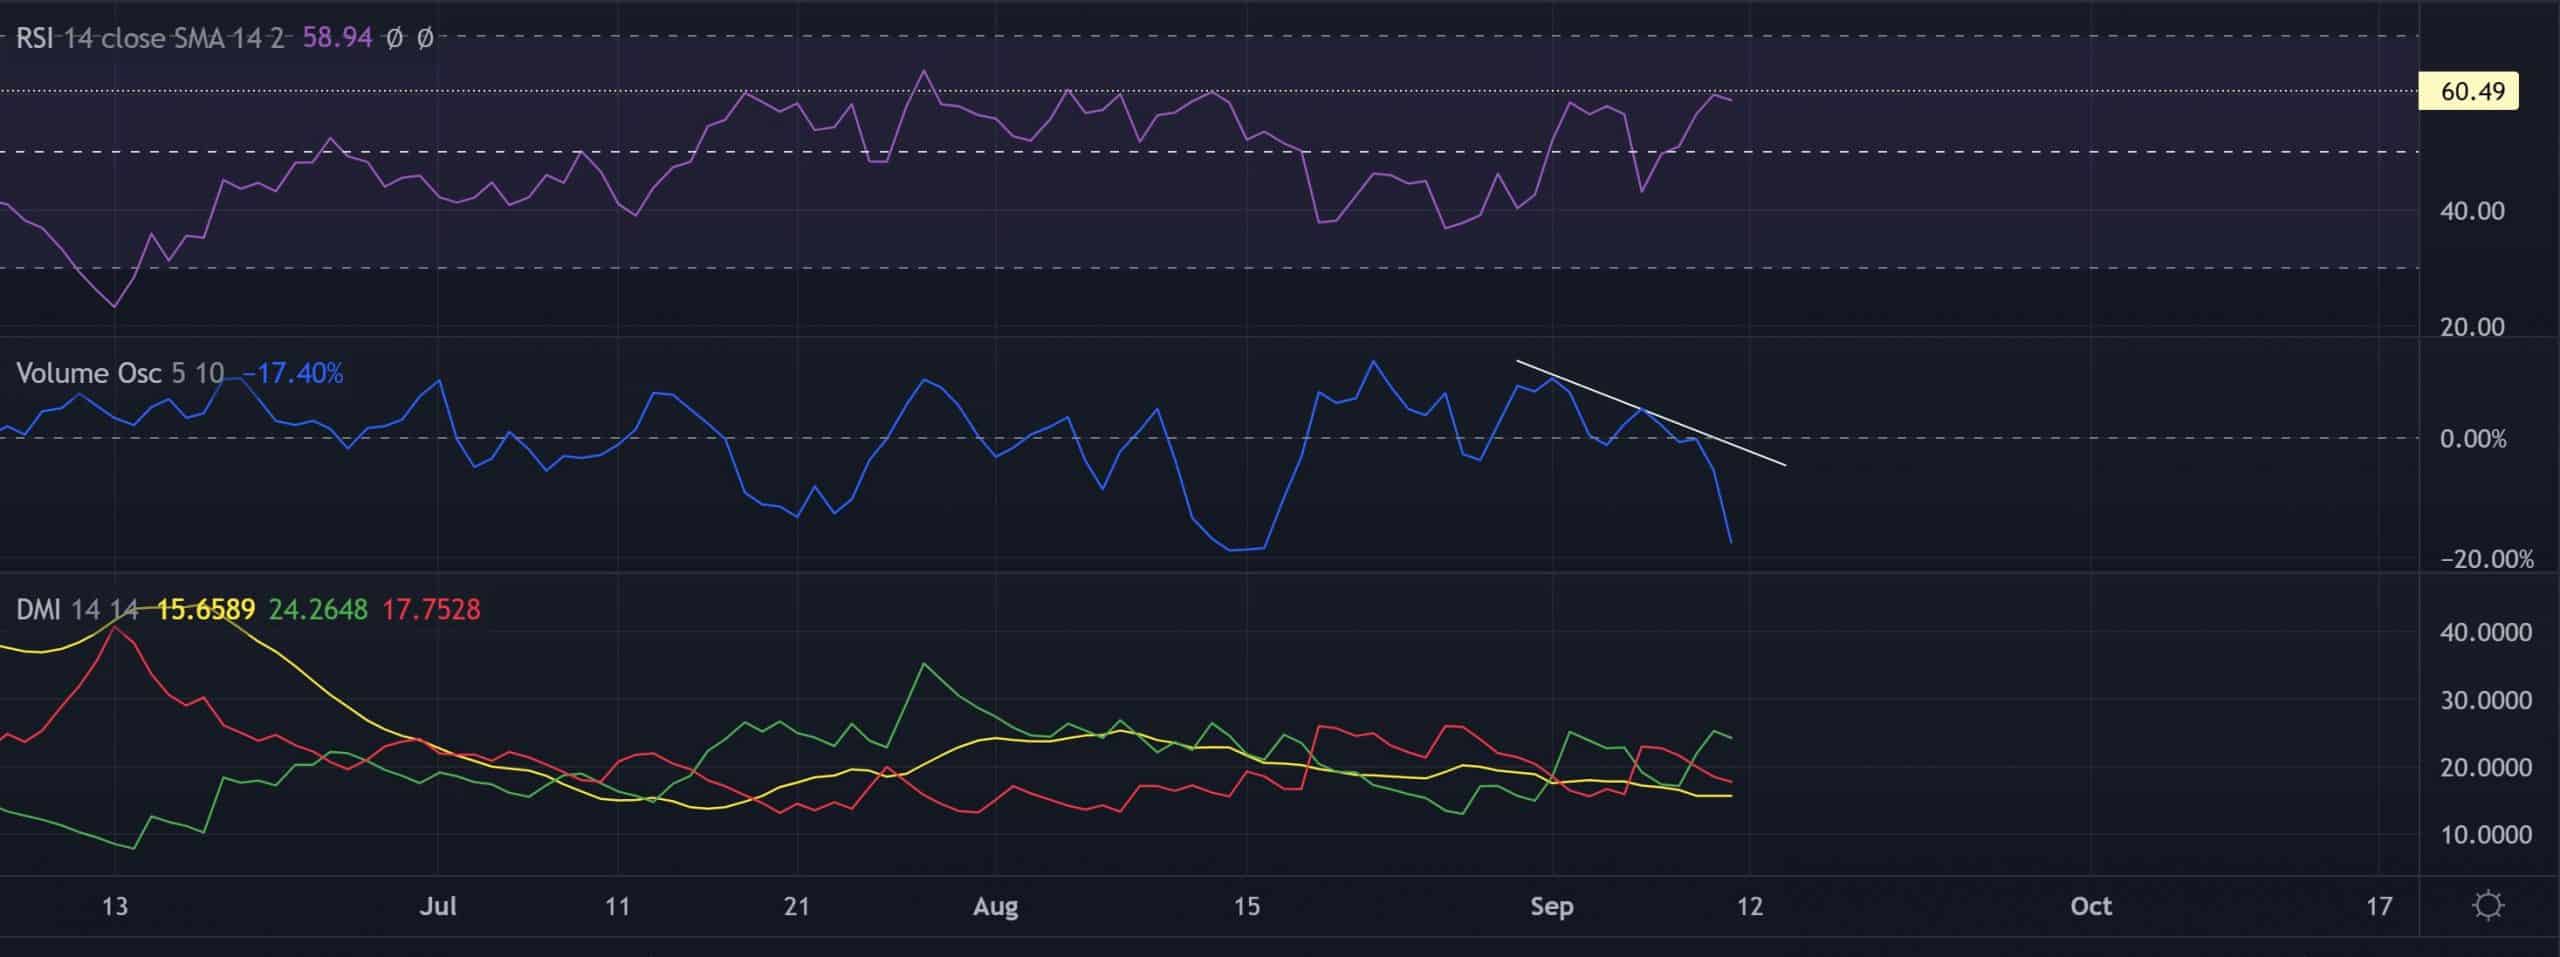
The Relative Strength Index (RSI) unveiled increasing buying edge, but plateaued at the 60-mark resistance. The bulls have struggled to find a comfortable close above this mark for over five months. Buyers should look for a breach of this level to confirm bearish invalidation.
However, the Volume Oscillator’s (VO) lower peaks highlighted a somewhat bearish divergence. This reading projected the weakness of the previous bull run. Nonetheless, the altcoin’s directional trend [ADX] still struggled to improve its weak position.
Conclusion
Given the sturdiness of the $62-$64 resistance range alongside the reversal pattern, LTC could see an ease in the reviving buying pressure.
Even so, the bullish crossover of the 20/50 EMA kept long-term recovery hopes alive near the $58-zone. The targets would remain the same as discussed.
Finally, LTC shares a 61% 30-day correlation with BTC. Ergo, a look at Bitcoin’s movement will be crucial for making a profitable move.

![Tron [TRX]](https://ambcrypto.com/wp-content/uploads/2025/08/Tron-TRX-400x240.webp)


