Litecoin [LTC] traders can leverage these price levels for their profit

Disclaimer: The findings of the following analysis are the sole opinions of the writer and should not be considered investment advice
Recent market-wide gains helped Litecoin [LTC] buyers reclaim the $53-level over the past 24 hours. As a result, the altcoin quickly jumped above the EMA ribbons to project strong buying momentum.
Furthermore, the recent bullish engulfing candlesticks reflected a solid uptick in buying pressure. Sustained rejection of higher prices in the $55-zone could inflict a near-term pullback before the altcoin’s likely revival.
At press time, Litecoin was trading at $55.355, up by 7.65% in 24 hours.
LTC 4-hour Chart
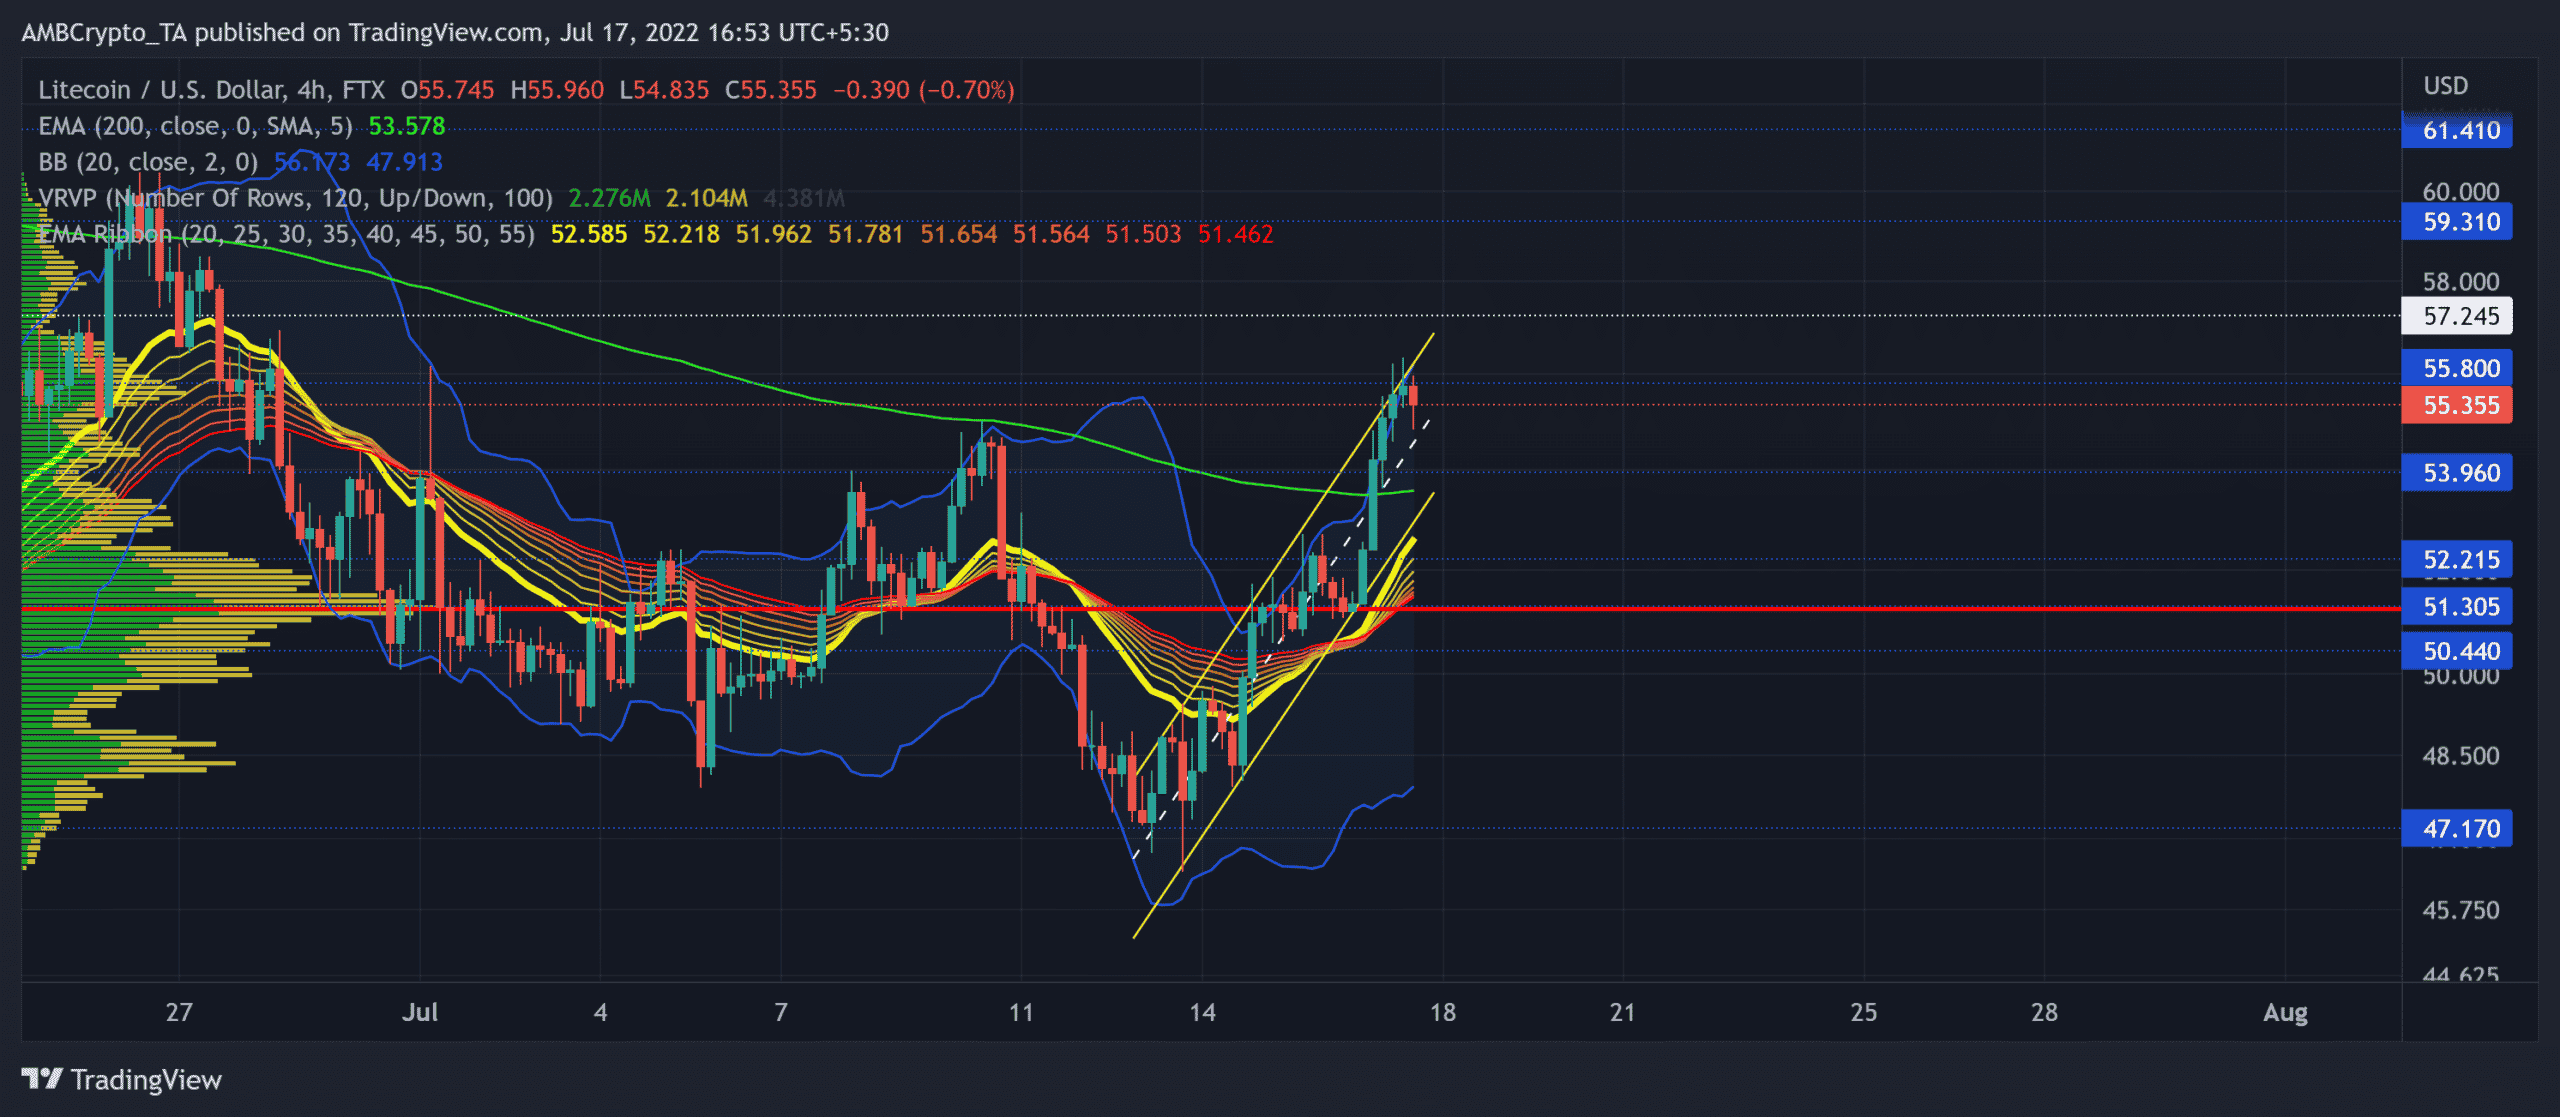
The altcoin’s buying resurgence led it to test higher peaks over the last two weeks. While the bears ensured the $55-level, LTC saw an ascending channel movement over the previous five days.
After a brief compression phase near the Point of Control (POC, red), the crypto finally saw a volatile breakout in favor of the buyers. LTC has been displaying strong rejection of higher prices around the $55.8-zone.
With the EMA ribbons finally looking north, the bulls aimed to steer the long-term trend. A bullish crossover with the 200 EMA (green) can position the alt for a sustained long-term uptrend.
An immediate rebound from the $55-mark can help buyers retest the lower trendline of the up-channel. Any close below the channel could expose the alt to a short-term pullback. In this case, LTC could head towards the $52-zone or near its POC before the bulls step in to provoke the buying pressure.
Rationale
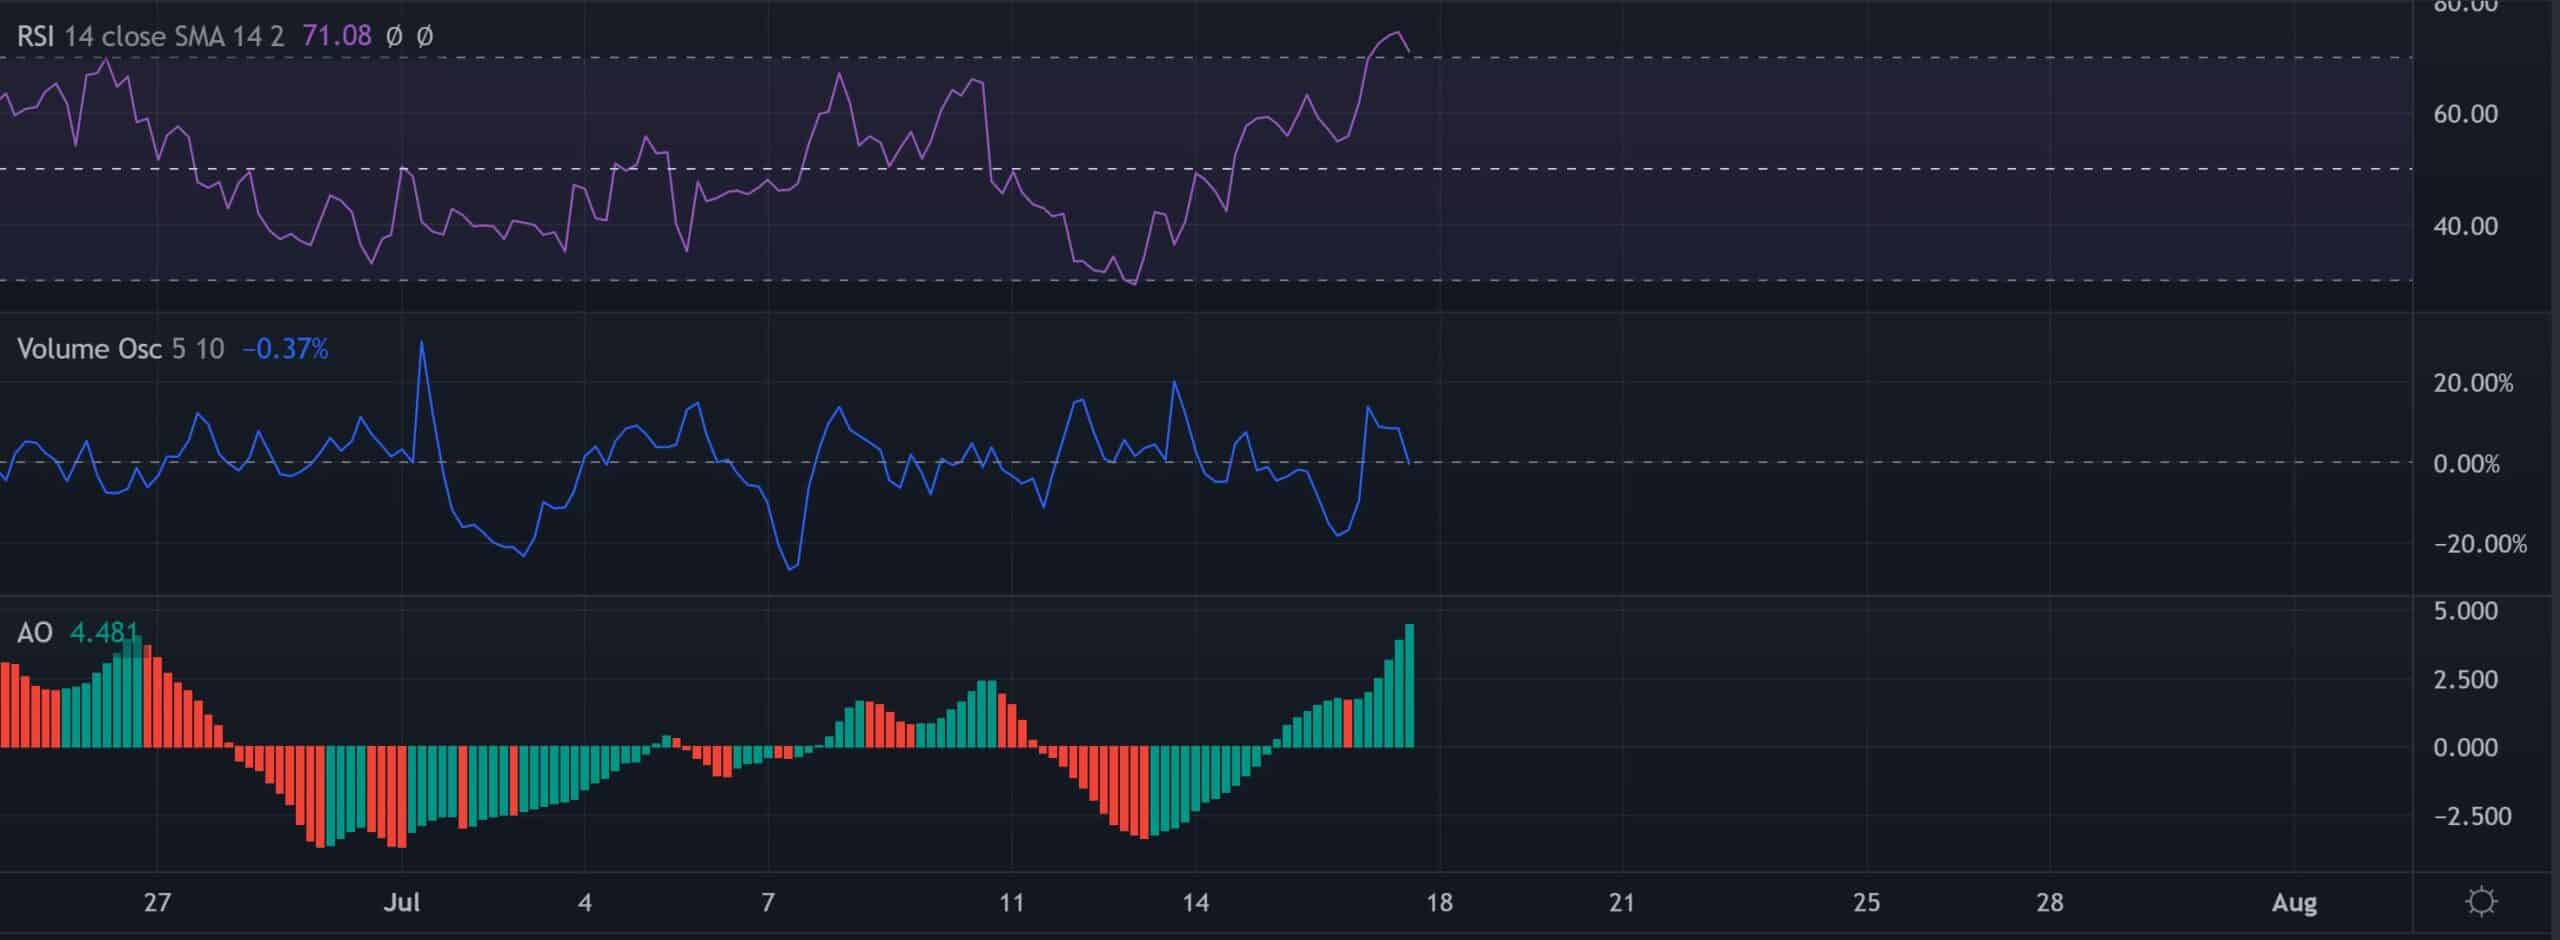
The Relative Strength Index (RSI) finally saw a reliable close beyond the overbought zone. A likely reversal from this level could ease the buying pressure in the coming sessions.
Also, the Volume Oscillator marked lower peaks, unlike the price action’s higher highs. This revealed a bearish divergence. Interestingly, the Awesome Oscillator touched its monthly high and exhibited a strong buying edge while reaching its reversal zone.
Conclusion
Given the confluence of resistances and the near-term indicators, LTC could likely see a hurdle in the $55-zone. A fall below the pattern would trigger a shorting signal with the targets mentioned above.
However, LTC shares an 69% 30-day correlation with the king coin. A close eye on Bitcoin’s movement would be imperative to make a profitable move.


