
Solana – Here’s why Wall Street should pay attention to SOL now!
Altcoin

Litecoin needs to reclaim this level as support before bulls can make a comeback
Posted:
Journalist

Litecoin had an amazing start to November as it shot past the $200 mark and rocketed to a $295 high. However, the past six weeks have pulled Litecoin back to the $140 lows. Bitcoin experienced a short-term bounce, but bullish strength was not seen as much on longer timeframes. What Litecoin can achieve in the coming weeks will be dictated mostly by what Bitcoin does in the market. The bulls will have a fighting chance if Litecoin can flip the $176 level to support.
LTC- 1D

Source: LTC/USDT on TradingView
The drop from $295.7 to $129.3 was used to plot Fibonacci retracement levels (white). At the time of writing, the $143 long-term support (green) was held. Plus, the $168 level posed as resistance.
In late August, the price topped out at $232 and this coincided with the 61.8% retracement level, reinforcing it as significant resistance.
A different set of Fibonacci retracement levels were plotted based on LTC’s plunge from $413 to $103. The 23.6% retracement level for this move was at $176. Generally, the price consolidates above the 23.6% level for a while before it can run toward the 38.2% and 50% levels.
Moreover, in October, we saw prices bounce from $140, climb to $180 and higher. Thereafter, retest the $176 area in search of demand. If Litecoin can exhibit a similar price action in the coming weeks, it would likely encourage buyers to bid heavily on the $176 retest, if it occurs.
Rationale
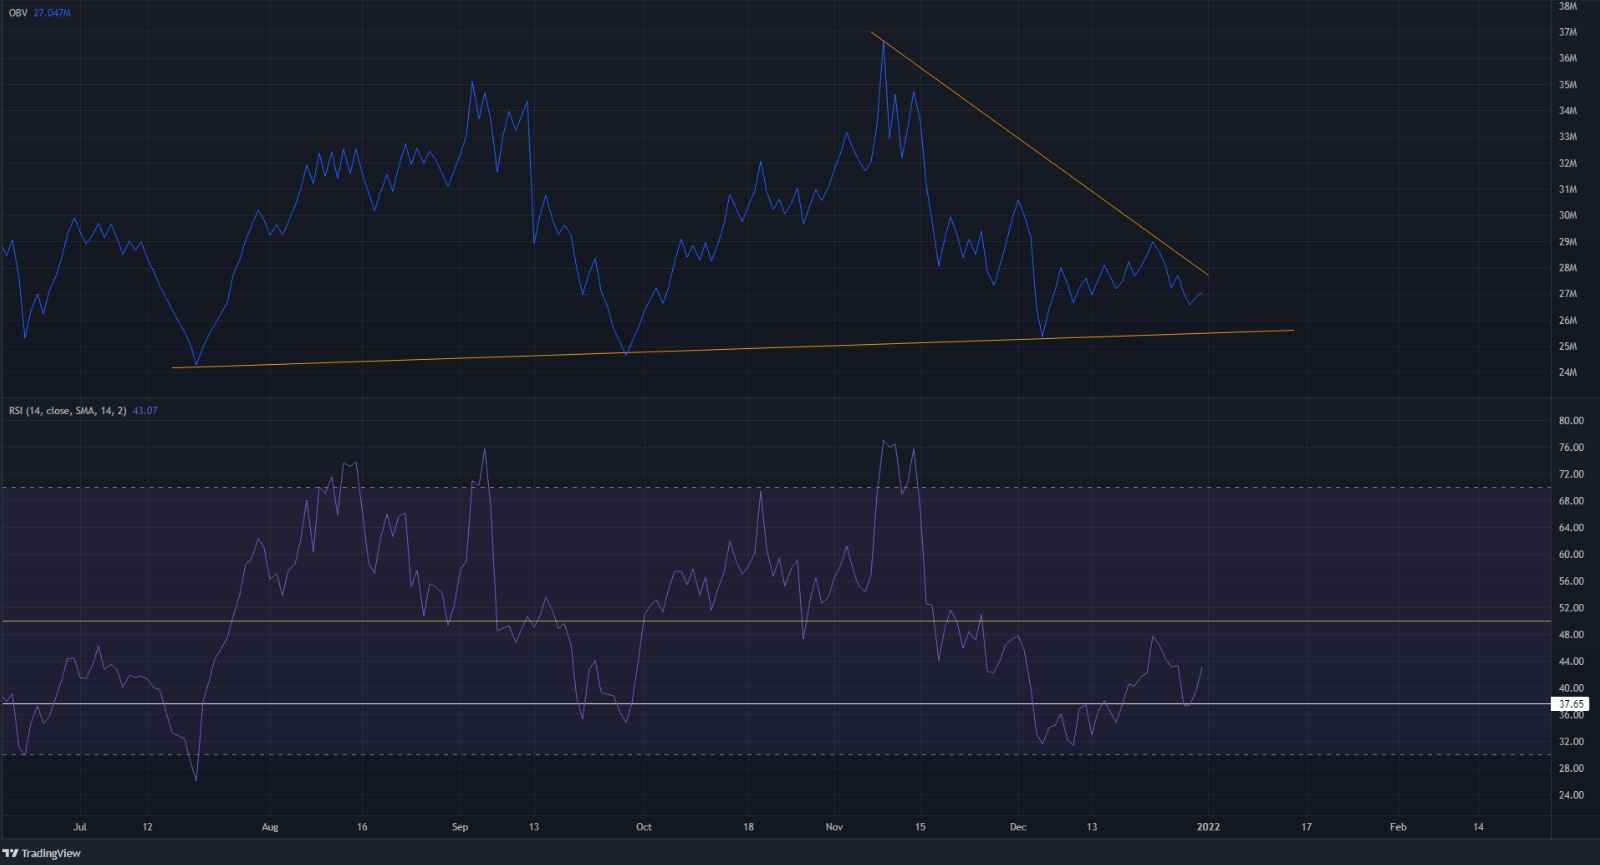
Source: LTC/USDT on TradingView
The OBV has been forming higher lows in the past few months. However, it has been strongly trending downward since the November peak. The OBV has to begin to set higher highs for the bullish scenario to play out.
The RSI also bounced off the 37.65 level. In the past (late March, June, late September), the RSI had bounced off the 35-37 area. Even in December, this level was one of resistance, and only recently has LTC flipped it to support.
Conclusion
Investors would have to wait and see if the $176 can be flipped from supply to demand. Flipping the longer-term 23.6% retracement level was something that saw LTC run to $232 and $295. A similar feat could possibly be repeated in the weeks to come.


