Litecoin, NEM, Status Price Analysis: 06 March

Litecoin required a break above its 200-SMA to flip its bear market conditions. NEM shrugged off a minor pullback and rose sharply on the back of strong buying activity. Finally, bullish momentum picked up for SNT, with the $0.088-resistance level likely to be breached moving forward.
Litecoin [LTC]

Source: LTC/USD, TradingView
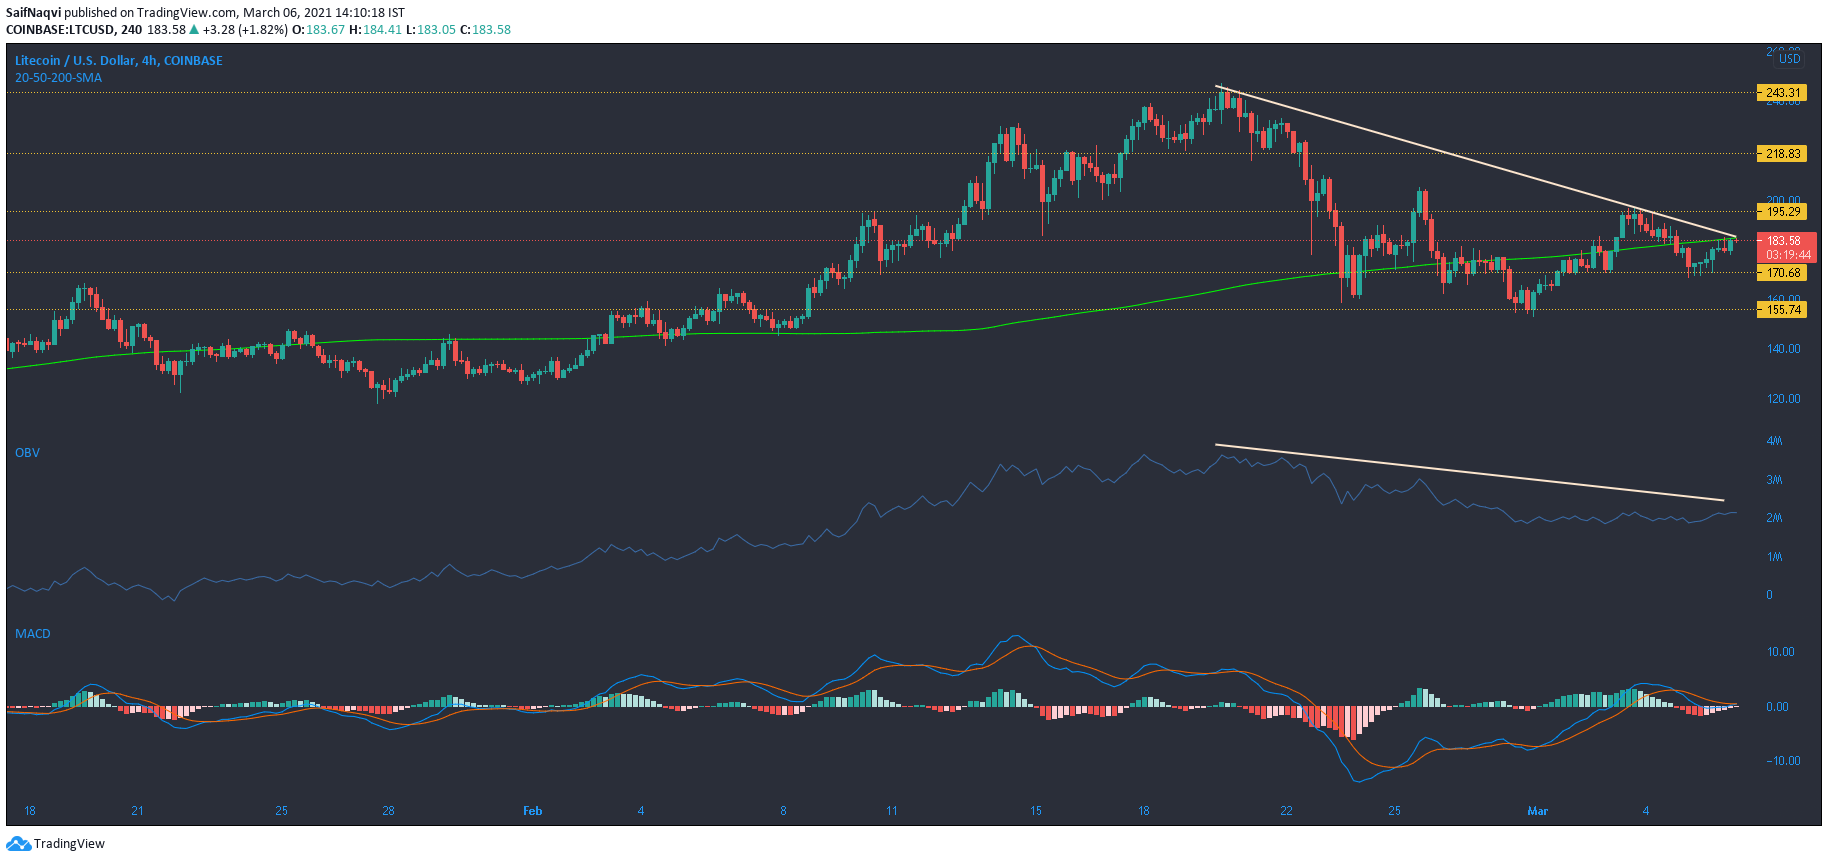
Lower highs over the past few trading sessions registered the dominance of sellers in Litecoin’s market. The On Balance Volume moved in tandem with the price and highlighted the lack of buying in the market post-LTC’s fall from a multi-year high of $247. To overturn its bearish market, bulls would first need to target a rise above the 200-SMA which acted as a resistance line on the 4-hour chart.
A bullish crossover in the MACD was a step in the right direction. The histogram showed that momentum grew on the buyers’ side. However, the 24-hour trading volumes were still on the lower side and a pickup would be needed to target a northbound move towards the $195.3-resistance level.
NEM [XEM]

Source: XEM/USD, TradingView
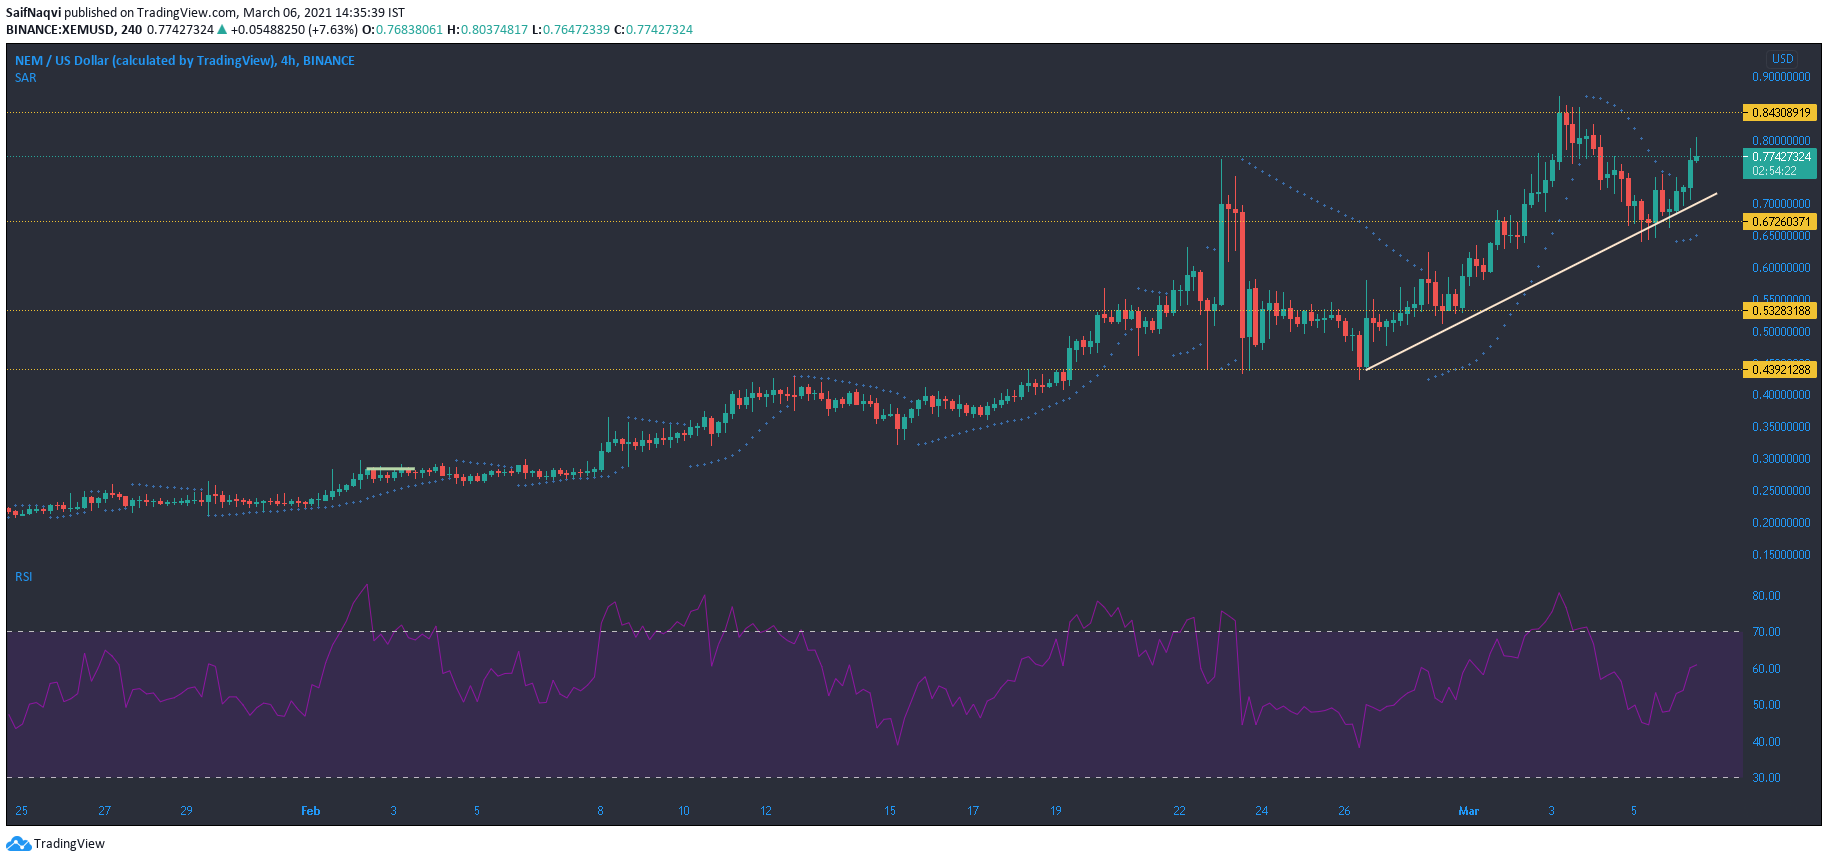
While broader market pullbacks have had a negative impact on NEM’s prices, the cryptocurrency bounced back from its various support levels and maintained its healthy uptrend on the charts. The uptrend reflected in gains over the past 30 days since they amounted to over 190%. At the time of writing, the price had surged by an additional 18% in the last 24 hours as NEM found itself among the top-15 in CoinMarketCap’s crypto-rankings.
The Parabolic SAR’s dotted markers moved under the candlesticks as NEM resumed its northbound trajectory post a minor correction. The RSI pointed north from the 60-mark as bulls maintained dominance in the market. A hike above the $0.85-local high looks certain in the short-term.
Status [SNT]

Source: SNT/USD, TradingView
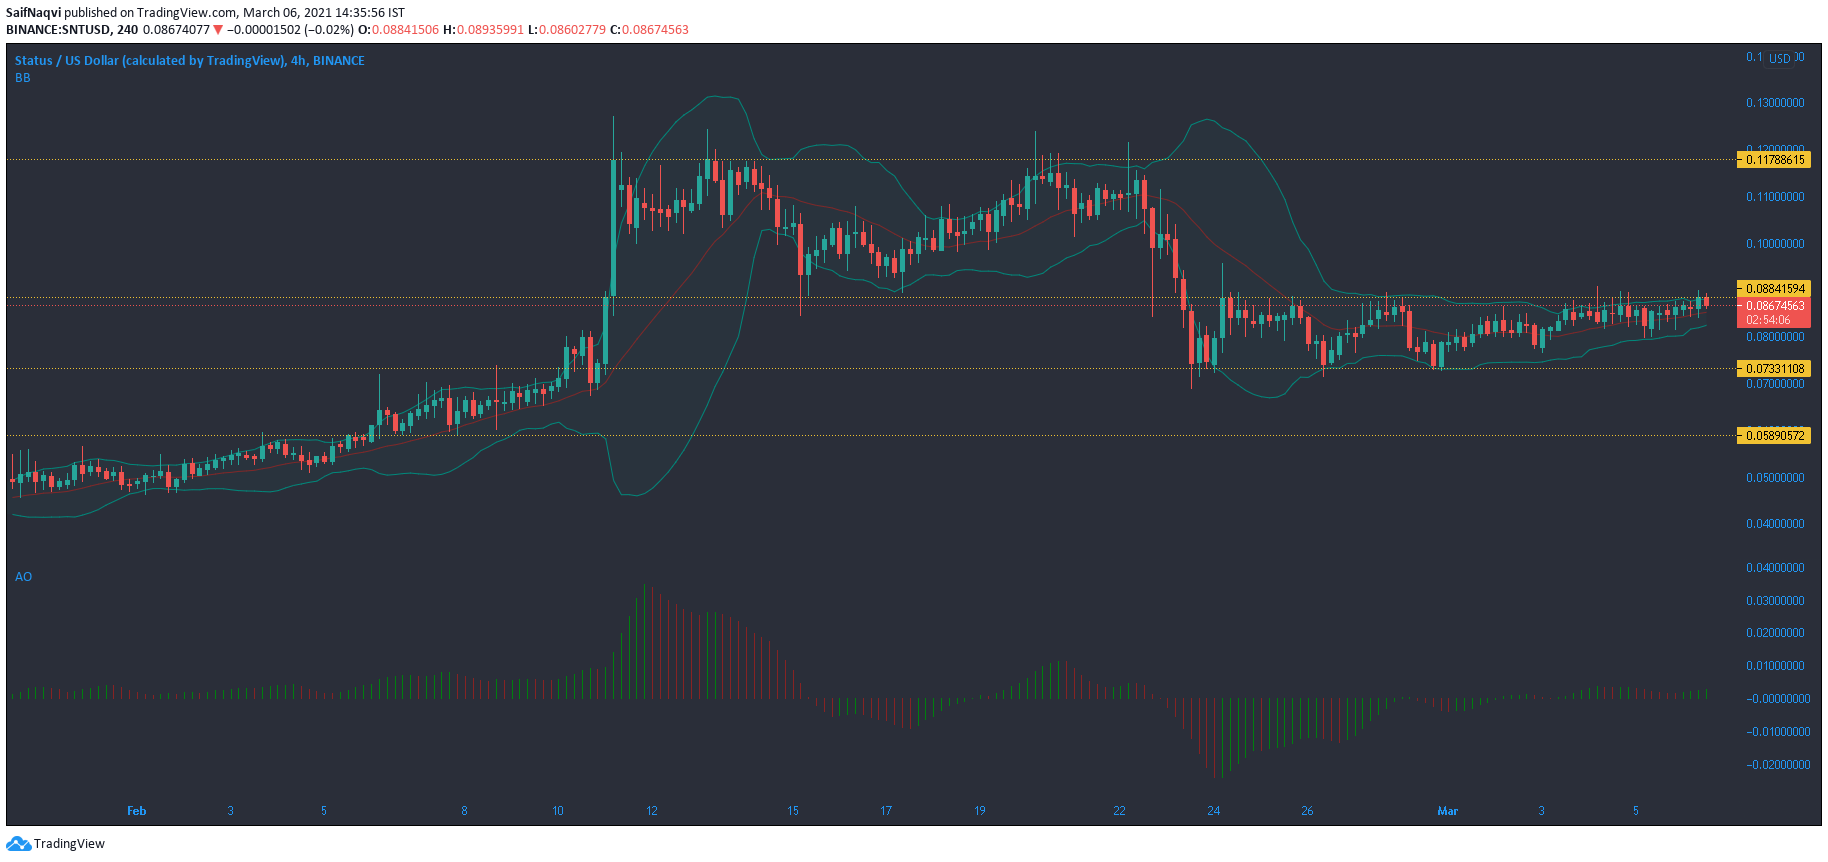
The Bollinger Bands were constricted on Status’s charts as the price oscillated between $0.088 and $0.073 for nearly two weeks. The lack of trading volumes and buying activity worked against a breakout above the immediate resistance level. However, both the aforementioned factors picked up during the time of writing and indicated that SNT bulls could retake the $0.088-level from the bears.
The Awesome Oscillator’s green bars added to the optimism even though there was a dearth of strong momentum in the market. If the green bars continue their ascension above the equilibrium mark, SNT could be eyeing additional gains in the coming sessions.


