Litecoin, Neo, UNI Price Analysis: 03 February

Litecoin steered clear of its 200-SMA, with a broader market rally likely to push the crypto’s price north of its $154.7-resistance level. NEO could move within a fixed channel over the next few sessions, especially since the trading volumes were subdued across the market. Finally, UNI’s consolidation phase could last for a few more sessions before rising once again on the charts.
Litecoin [LTC]
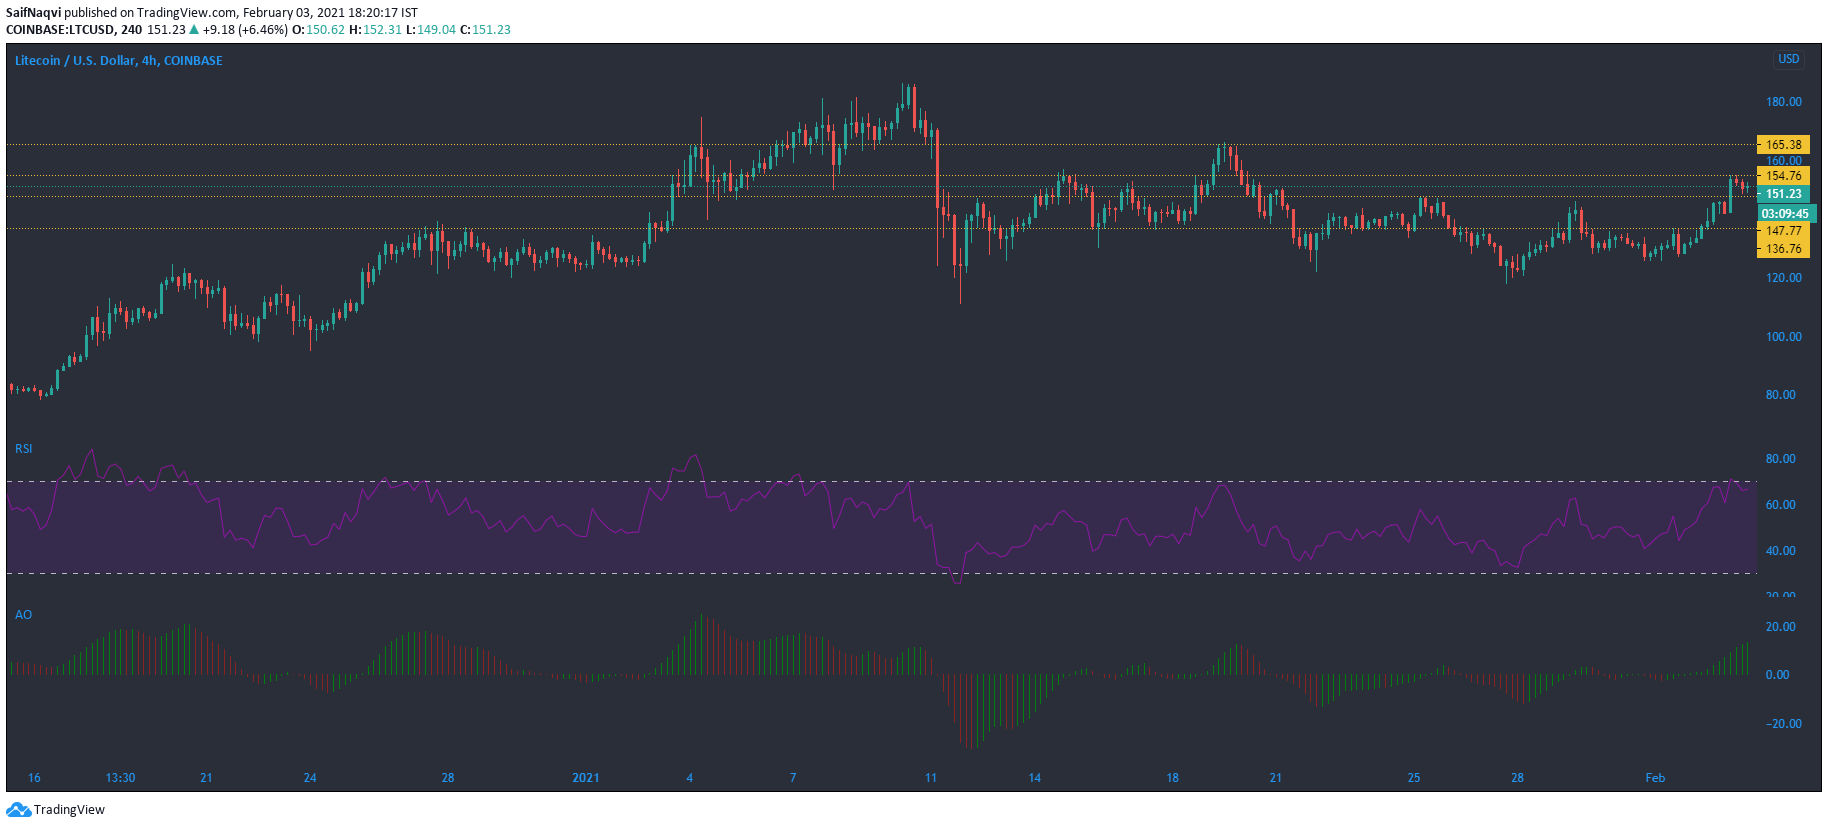
Litecoin climbed above its 200-SMA (green) after a broader market rally pushed Litecoin by over 7% in the last 24 hours. The crypto’s latest surge also pushed LTC’s market over the $10 billion mark, at the time of writing. However, its gains were capped at the $154.7-resistance level as some selling pressure was also seen over the past couple of trading sessions.
The Relative Strength Index for Litecoin projected a bearish pullback as it dropped below the overbought zone. Despite the bearish prediction, a move below its press time support level was unlikely.
On the other hand, the Awesome Oscillator highlighted strong bullish momentum as the green bars rose above the equilibrium mark. If the bears lose out to the press time resistance, LTC could test the upper ceiling at $165.4.
Neo [NEO]
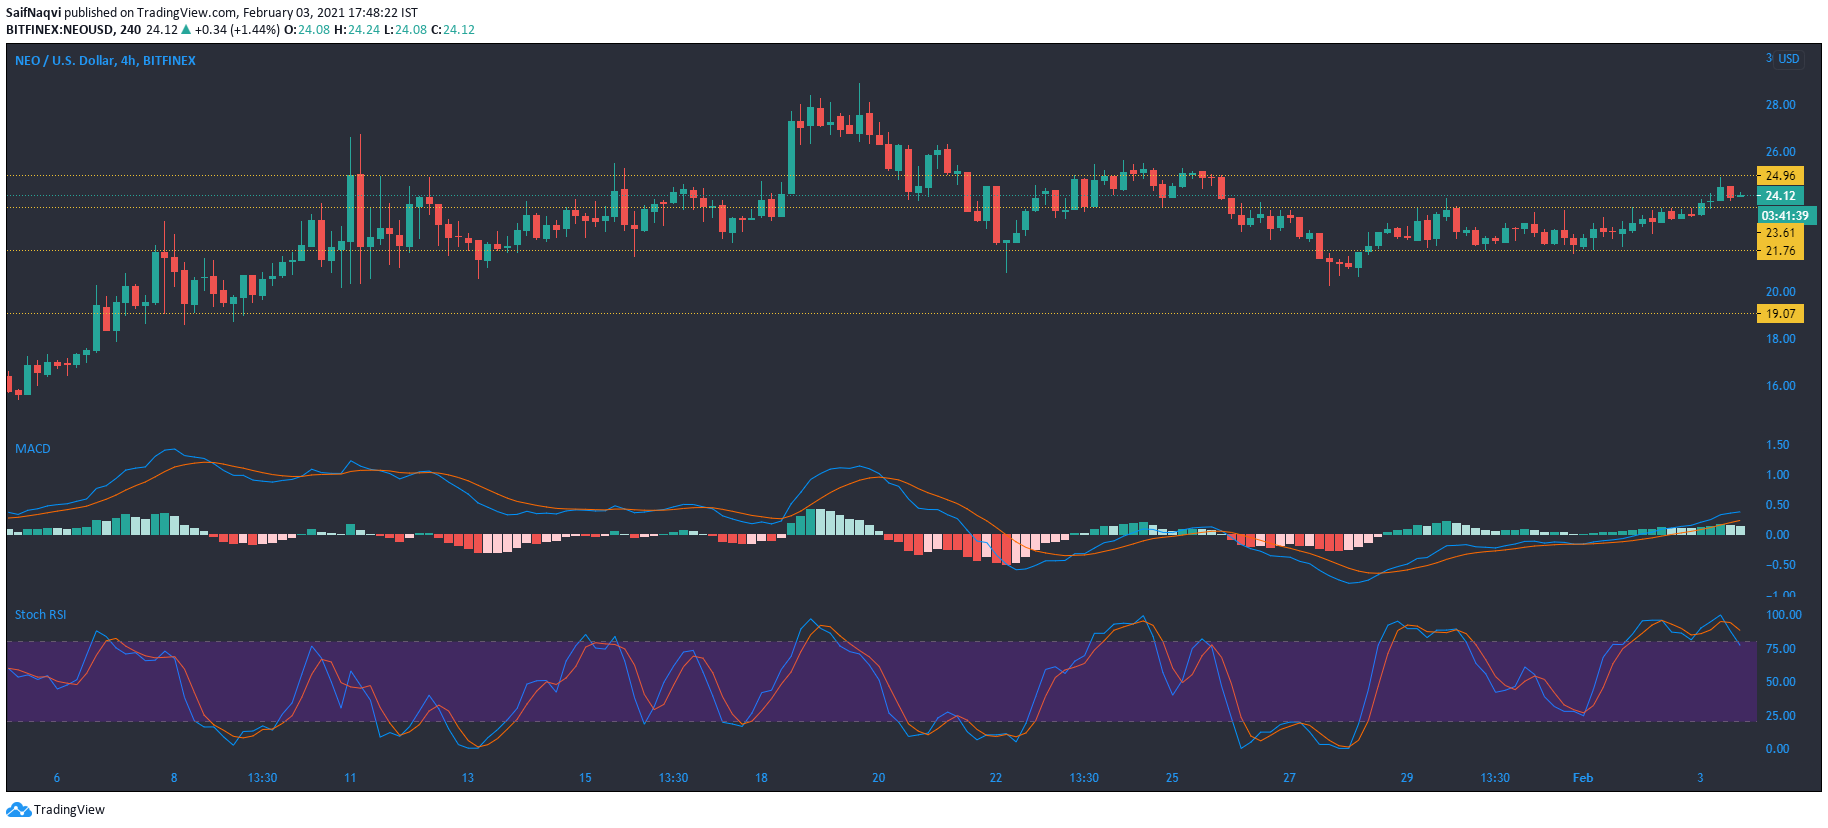
Although Neo flipped its $23.6-resistance, a move above the next test at $25 seemed unlikely as trading volumes slipped over the past 24-hours and so did the buying activity. Some rangebound movement can be expected over the next few trading sessions if the price maintains itself above the press time support level.
The Stochastic RSI favored the sellers as a bearish crossover was seen in the overbought zone and even though the MACD line moved above the Signal line, the histogram showed that the market’s bullishness was losing steam.
Uniswap [UNI]
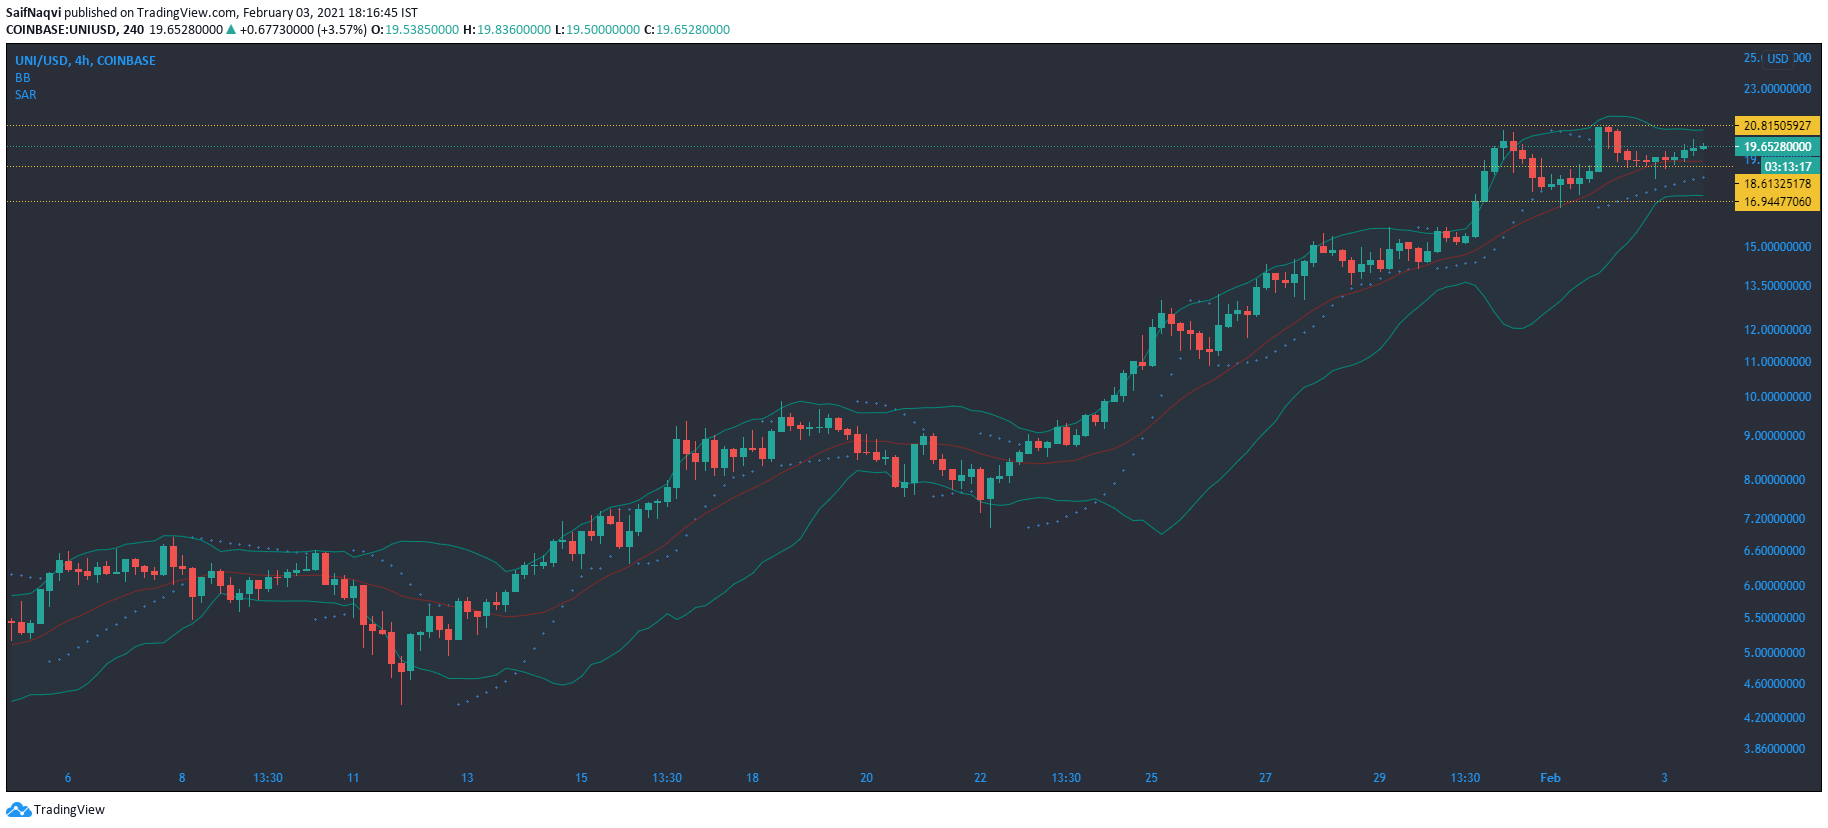
Uniswap’s bullish rally seemed to cool down, at the time of writing, after a buying storm pushed the DeFi token by over 200% in the last 30 days. As its market cap increased to above $5.5 billion, UNI climbed on the rankings and positioned itself as the 13th largest cryptocurrency by market cap. However, a drop of nearly 18% in the 24-hour trading volume suggested that interest was waning in UNI’s market.
The Bollinger Bands showed that the price volatility was decreasing as the bands were compressed. However, UNI’s bull market did not seem to be threatened as the price moved above the 20-SMA. The Parabolic SAR’s dotted markers also outlined the short-term uptrend as the dotted markers were below the candlesticks. The consolidation could spill over the next few sessions before a rise is witnessed once again on the charts.