Litecoin: On LTC’s underperformance, upcoming halving, and block readiness

- A large percentage of blocks are ready for the Litecoin halving
- LTC declined following the broader market rise, but its value could increase in the long term
According to the Litecoin [LTC] halving tracker, the event would be held on 2 August 2023. But with 133 days to go, only a few things might be left as 90.78% of the blocks required have been produced.
Realistic or not, here’s LTC’s market cap in BTC’s terms
The Litecoin halving acts as a means of slowing down the mining of LTC. This, in turn, boosts the asset’s scarcity. Also, miners get 6.25 LTC in rewards for their input this time. The current projection puts the halving at a block height of 2,520,000 at 9:49:07pm UTC on the said date.
Sprinkling bits left
At press time, only 77,489 blocks were left to hit the required block height. Despite the preparation, LTC did not seem to reflect investors’ delight. Even so, the coin has massively underperformed in the last 30 days
The likes of Bitcoin [BTC], Ethereum [ETH], and several other cryptocurrencies reached a yearly high in the course of the sustained uptrend. However, Litecoin has only remained above $80 after a 19.13% decline over the last month.
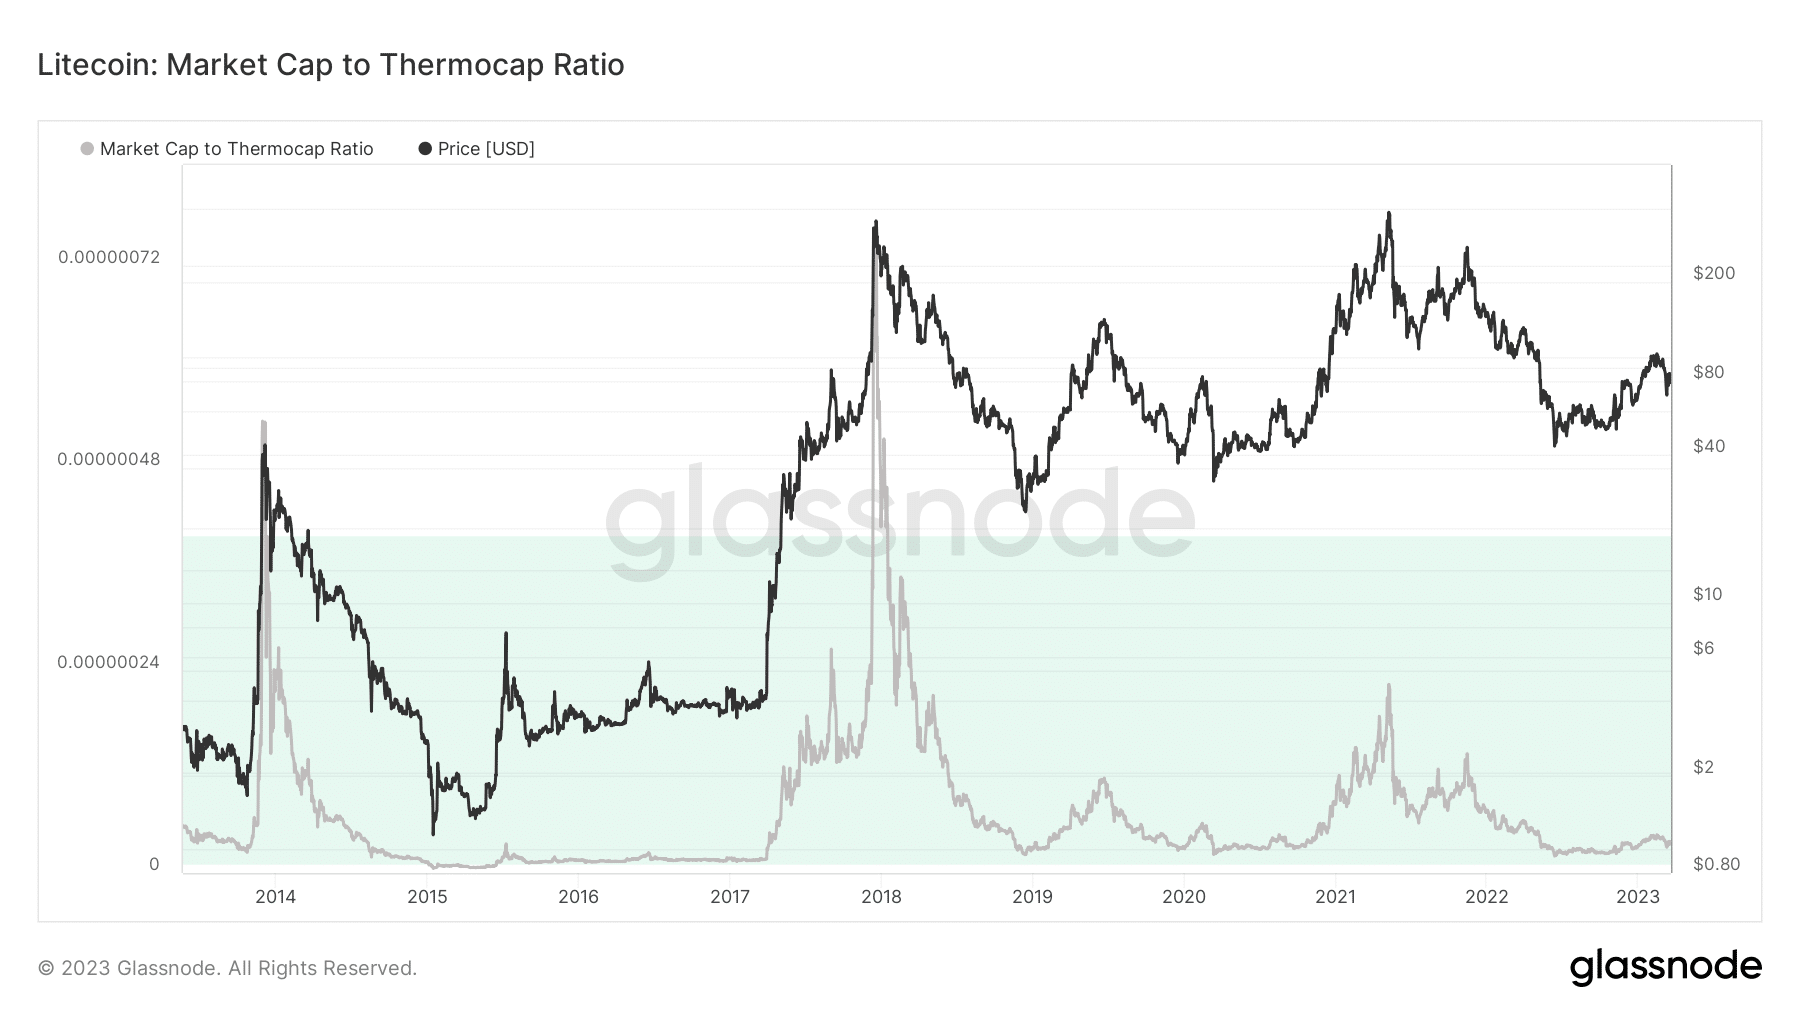
Regardless, it seems that LTC had the potential to improve from its current value. This was because of the position displayed by the market cap to Thermo cap ratio. The metric evaluates if an asset is trading at a premium with respect to the total miner spend. Also, the ratio is usually adjusted to account for increasing circulating supply.
As of this writing, the market cap to Thermo cap ratio was 0.00000004. Such a low value means that the LTC was below exchanging hands at a fair or overvalued condition. Therefore, the LTC price could improve and possibly match up with its historical trend of excellent performance in a period like this.
LTC short and long-term could be…
On the technical side, LTC might continue to grapple based on indications from the Awesome Oscillator (AO). The AO displays momentum by comparing recent price movements with historical movements. At press time, the AO was -5.86, seemingly bearish. However, the coin was trying its might to claim a bullish take as green bars began to appear.
Is your portfolio green? Check the Litecoin Profit Calculator
Nonetheless, the chance of a short-term respite remained low. The reason for this projection was because of the Exponential Moving Average (EMA) stance. At the time of writing, the 50 EMA (yellow) was below the 20 EMA (blue), This aligned with the bearish position of the AO.
On the same chart, the 200-day EMA (cyan) was above the 50 EMA. This gives LTC a chance to change its trend to neutral, and a longer-term bullish trend.


![Litecoin [LTC] price action](https://ambcrypto.com/wp-content/uploads/2023/03/LTCUSD_2023-03-21_11-40-38.png)


