
Disclaimer: The findings of the following article ar the sole opinion of the writer and should not be taken as investment advice
Litecoin, the cryptocurrency dubbed the silver to Bitcoin’s gold, has emerged out of its bear market quite gracefully. Its 2020 YTD returns, at the time of writing, were 90%, a figure that wasn’t half bad. However, like all altcoins, LTC has suffered over the previous month after playing to Bitcoin’s tune. LTC’s price hit a high of $95, but it soon fell to $64, a 32% drop experienced solely due to its correlation with Bitcoin.
However, considering Bitcoin’s latest upsurge, let’s analyze how Litecoin might perform in the long-term.
Litecoin 1-day chart
Source: LTCUSD on TradingView
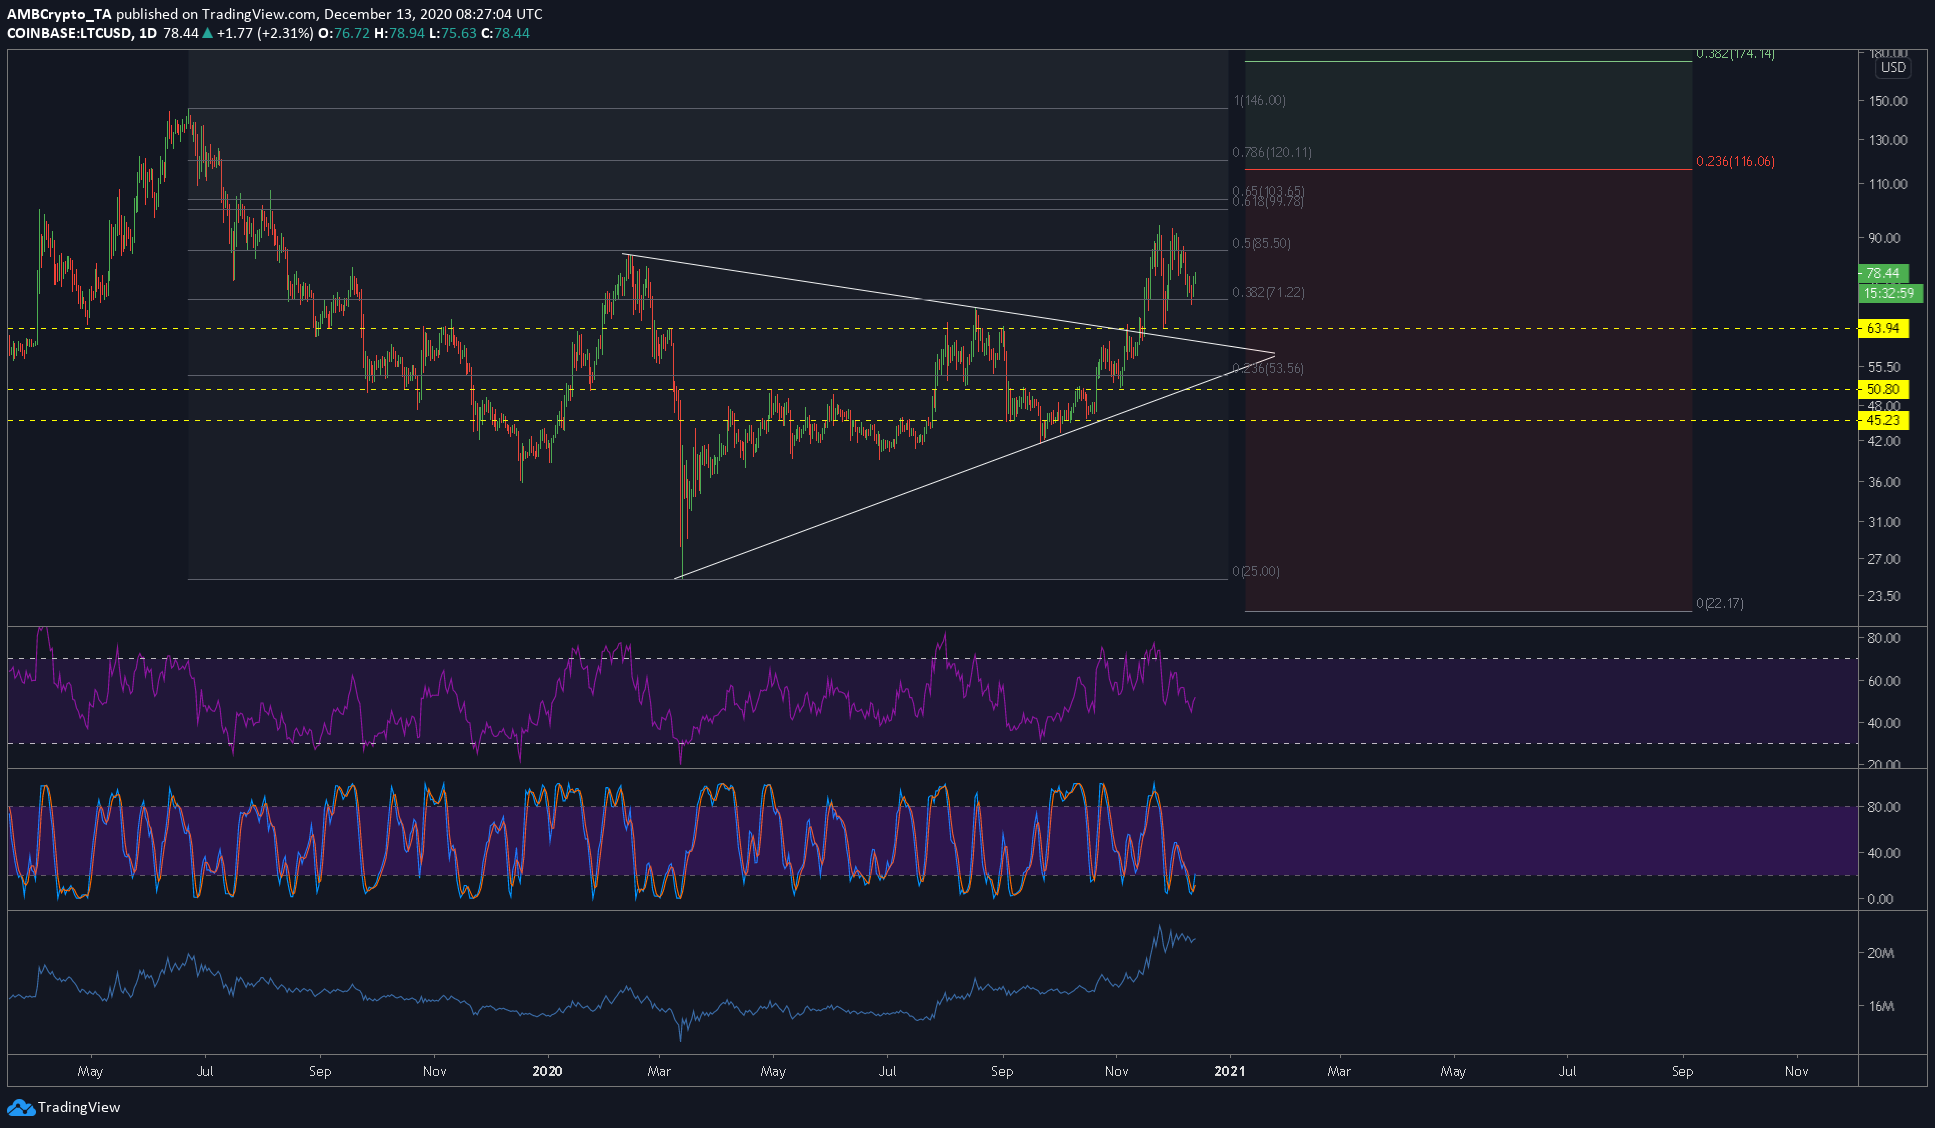
The chart attached herein takes into consideration trading data from early 2020 to-date. Clearly, LTC seemed to have broken its trend of forming lower highs as the price hit a higher high in November 2020. While this seemed bullish, we might see Litecoin go sideways for a while, and that is assuming that Bitcoin doesn’t have a volatile session as it did recently.
Overall, Litecoin’s setup looked like it might move sideways, but with a bullish bias. The symmetrical triangle was breached too as the price flowed out of it in November.
Rationale
The aforementioned breached pattern might still be of use if the price drops. In that case, the upper line will support the cryptocurrency’s price. However, a drop seemed unlikely considering the supports at the press time level.
The Fibonacci extension from LTC’s ATH to its ATL showed that a major resistance level was present at $116.06, a finding that meant that the price has room to surge by 40% to 50% until it hits this level.
The RSI indicator was observed to be in the neutral zone while the Stochastic RSI was bouncing off the oversold zone. The OBV indicator, however, showed consolidation of volume as the price saw a good surge, a finding indicating that this surge might be undone soon. Alternatively, we could see sideways movement due to volume consolidation.
The present bounce is happening from the $71.22-support level, which is the 0.382-Fib level of the secondary Fibonacci extension ranging from the recent top at $146 to the recent bottom at $25.
Conclusion
As mentioned above, there were multiple resistance levels from these fib levels that will make it hard for the price to push higher, at least after the golden pocket [which ranges from $99 to $103]. So, for the next few days, we might see a small surge in LTC’s price and it might move to $85 or $100, but anything beyond that seemed rather unlikely.


![dogwifhat's [WIF] 3-day rally has eyes glued, yet a hidden risk lurks](https://ambcrypto.com/wp-content/uploads/2025/04/Gladys-8-400x240.jpg)

