Litecoin Price Analysis: 31 December

Disclaimer: The findings of the following analysis are the sole opinions of the writer and should not be taken as investment advice
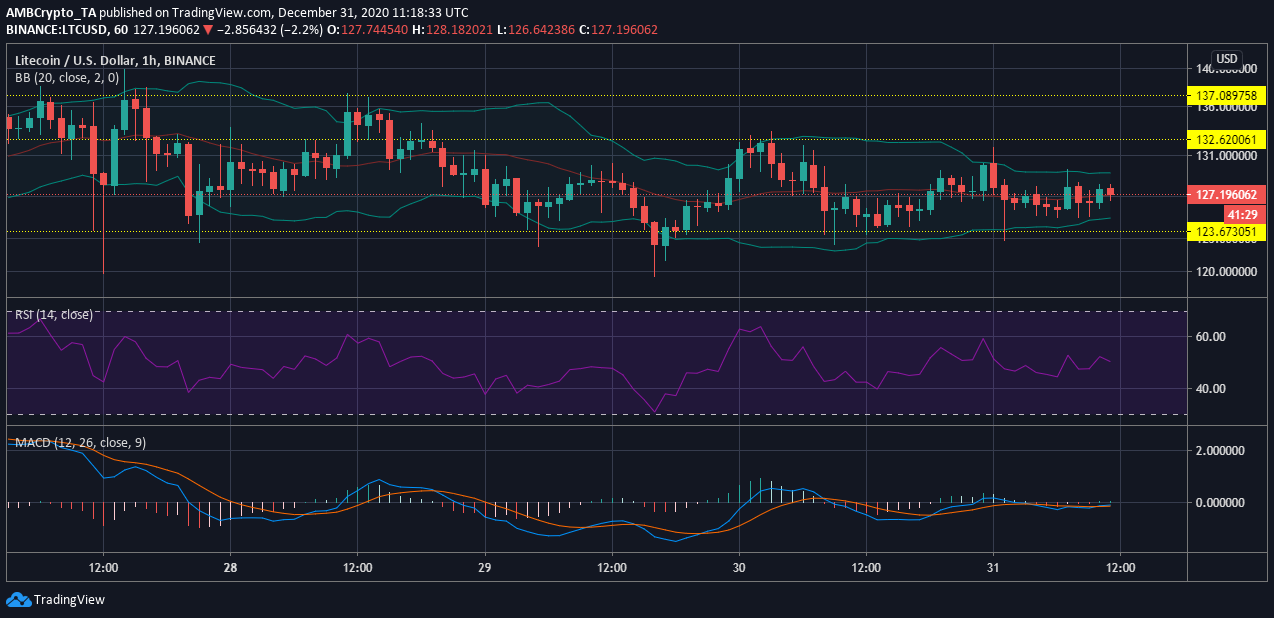
Litecoin’s market has been devoid of significant volatility, with its charts seeing very dull price movement. Despite its strong bond with Bitcoin, Litecoin has been consolidating on the charts, with LTC yet to see strong price movement. At the time of writing. the price of LTC was $127 while noting the emergence of strong selling pressure.
Litecoin one-hour chart

Source: LTCUSD on TradingView
According to the attached chart, Litecoin’s market has been consolidating between $123.67 and $132.62. However, since the coin has been moving within this range for a while now, the chances of a drastic price swing have been low. The cryptocurrency’s price was moving lower towards the support at $123.67, and traders may want to mitigate some losses by shorting this position.
Reasoning
The Bollinger Bands were indicative of the reduced volatility in the market. However, as such an erratic price movement has been witnessed before, the sudden selling pressure could increase the volatility briefly. The Relative Strength Index, while once close to the equilibrium zone, was pointing lower, signaling the emergence of selling pressure.
As previously noticed, the $123-level has been a strong support level, with the price reverting from this point. Even if the price continued to fall beyond this level, it may not drop to a great extent. The MACD line suggested an indecisive market, as the bars had also reduced. This affirmed the sideways movement of the digital asset.
Conclusion
Litecoin’s market did not witness a strong price swing and looking at the short-term market, a price swing may not be in the picture yet. As the selling pressure increases, given the downward trending price, the traders may be able to make a meager profit, but not a significant one. However, given its strong correlation with BTC, a fall might be imminent in the longer-term.


