Litecoin retests key support – Are bears running out of opportunities?

Disclaimer: The information presented does not constitute financial, investment, trading, or other types of advice and is solely the writer’s opinion
- LTC’s market structure was bearish.
- Price action retested the $81.81 support.
Litecoin [LTC] depreciated 20% since mid-February after price rejection at $103. The increasing market uncertainty since mid-February has increased selling pressure on LTC.
The U.S. Employment Report on Friday (March 10) could offer definite price action over the next few days/weeks and is worth tracking, especially for macro-investors.
A better-than-expected job report could lead to a market rally and boost LTC’s recovery, while dismal results would exert more selling pressure.
Read Litecoin [LTC] Price Prediction 2023-24
Can the bulls defend $81.89 support?
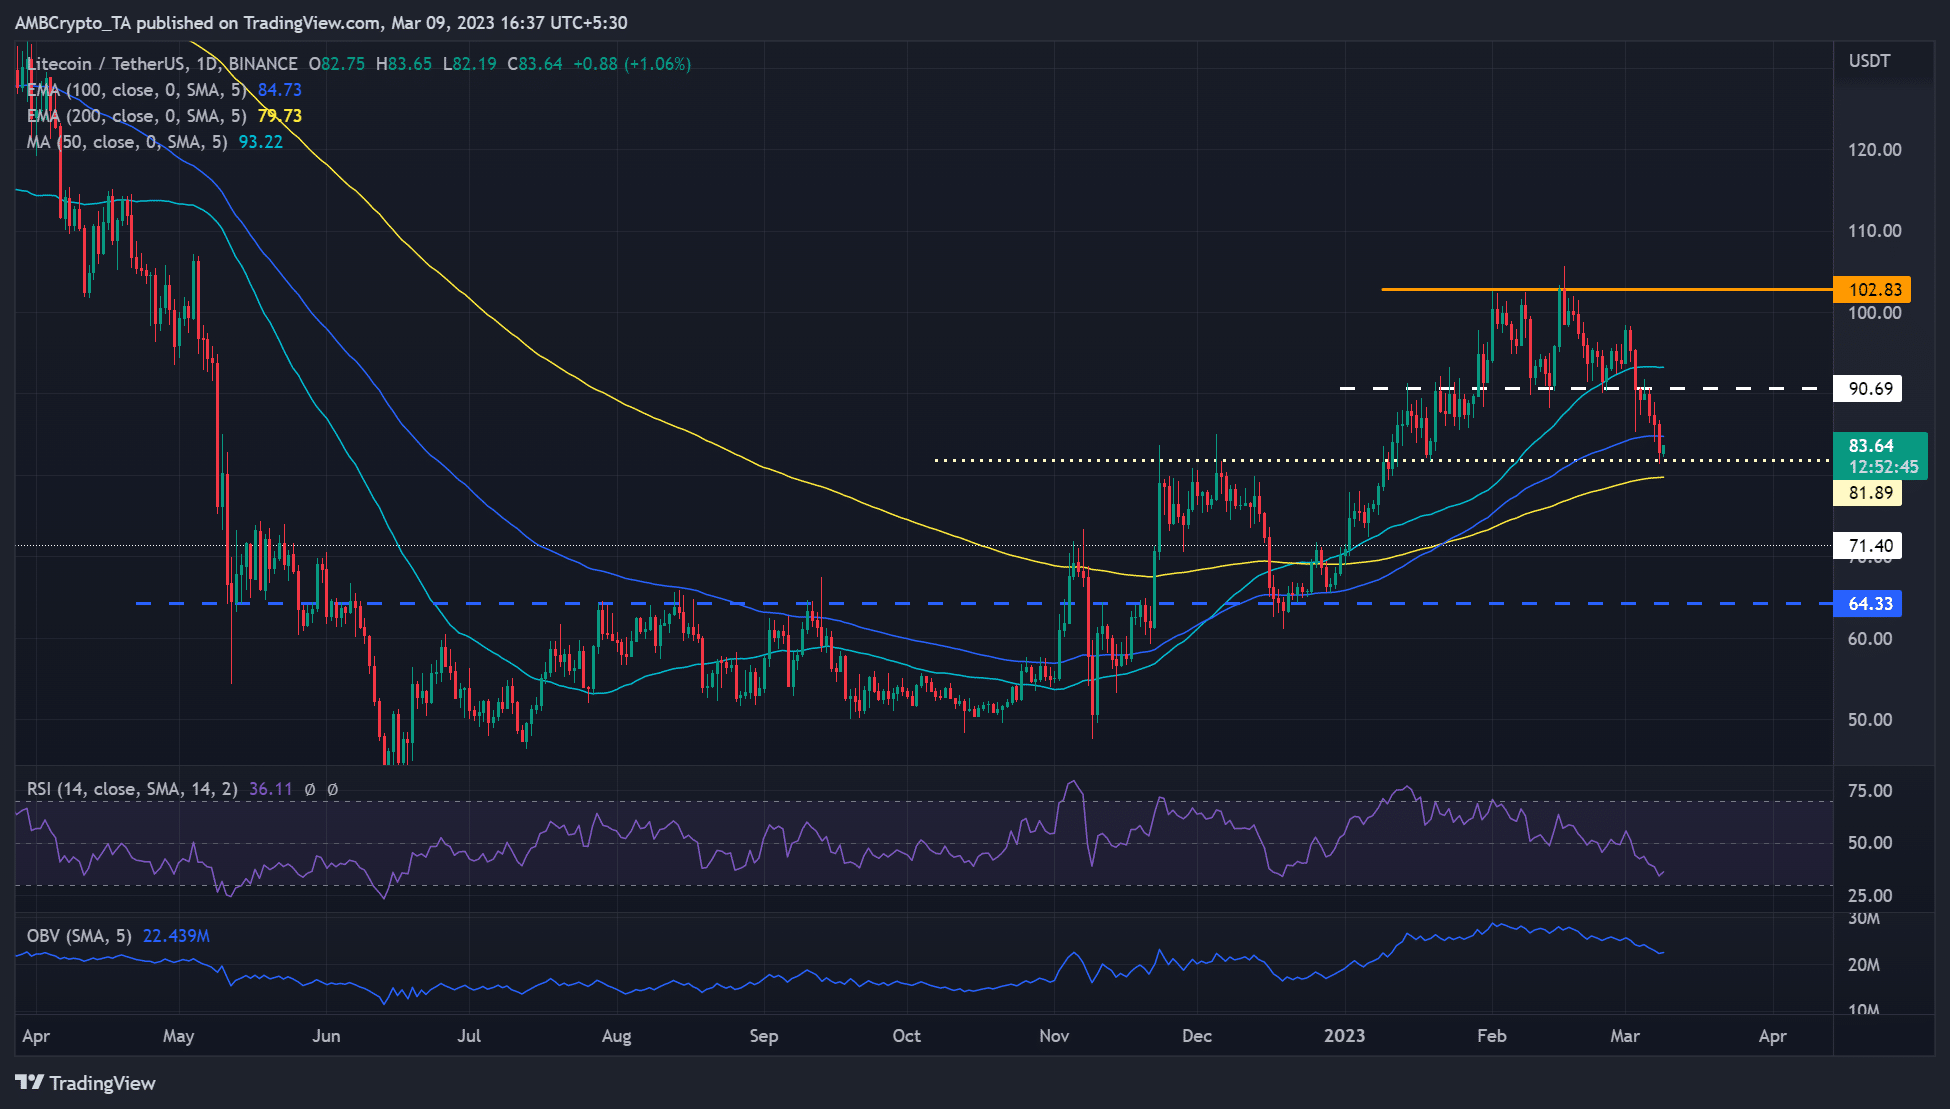
The $103 has been a key resistance level in February, preventing further upward LTC movement. LTC consolidated in the $103 – $90.7 range throughout February but broke the sideway structure on 3 March after bears breached the $90.7 support.
Bears cleared the hurdles at the 50-day MA (Moving Average), $90.7, and 100-day EMA (exponential moving average). At press time, the price rebounded from the immediate crucial support at $81.89 and could come to the bulls’ rescue if the jobs report is impressive.
Long-term bulls must defend the $81.89 support to keep bears off the market. The next hurdle for bulls would be the 100-day EMA ($84.73) to enable them to reach the target of $90.7.
Alternatively, LTC could face aggressive selling if bears dent the mild bullish sentiment by sinking it below $81.89. However, bears must clear the 200-day EMA to gain the leverage to devalue LTC toward $64.
The daily chart’s RSI (Relative Strength Index) was in the lower range, indicating intense selling pressure. In addition, the OBV (On Balance Volume) declined, suggesting that trading volumes dropped significantly in February.
90-day MVRV flipped to negative amidst unstable demand
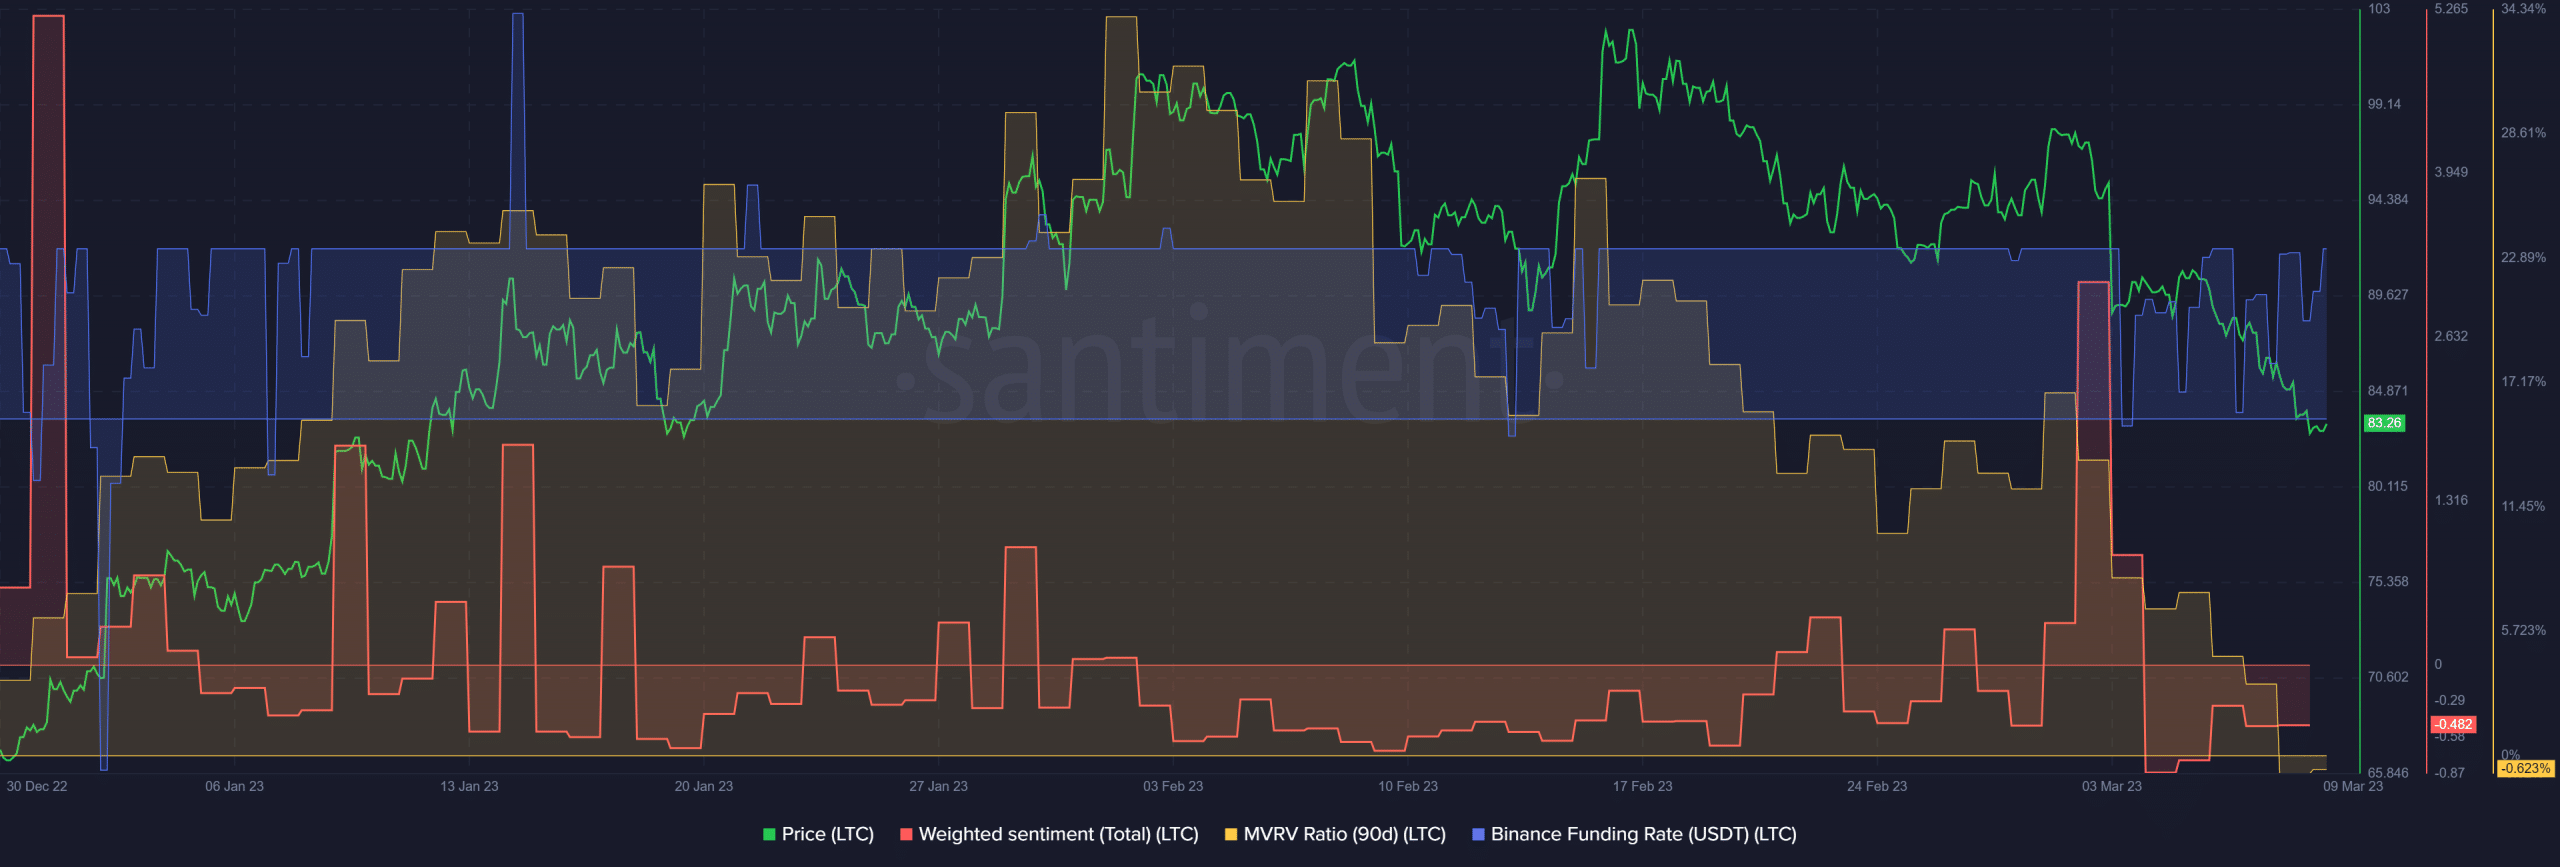
According to Santiment, LTC saw unstable demand in the derivatives market since the beginning of March, as shown by the fluctuating Funding Rates.
In addition, the 90-day MVRV (Market Value to Realized Value) ratio declined and flipped to negative at the time of writing. It shows quarterly LTC holders’ profits were cleared, and they were suffering losses at press time.
Is your portfolio green? Check the LTC Profit Calculator
Although the weighted sentiment slightly improved, it was still in the negative territory, further capturing the underlying market uncertainty; but the price direction could be defined after the jobs report on March 10.