
Litecoin jumped above key resistance at $295. Solana presented some target levels via the Fibonacci tool but stabilization could take place before the next leg upwards. Finally, Ethereum needed to hold on to $3,200-support to avoid a sell-off towards $2,790.
Litecoin [LTC]
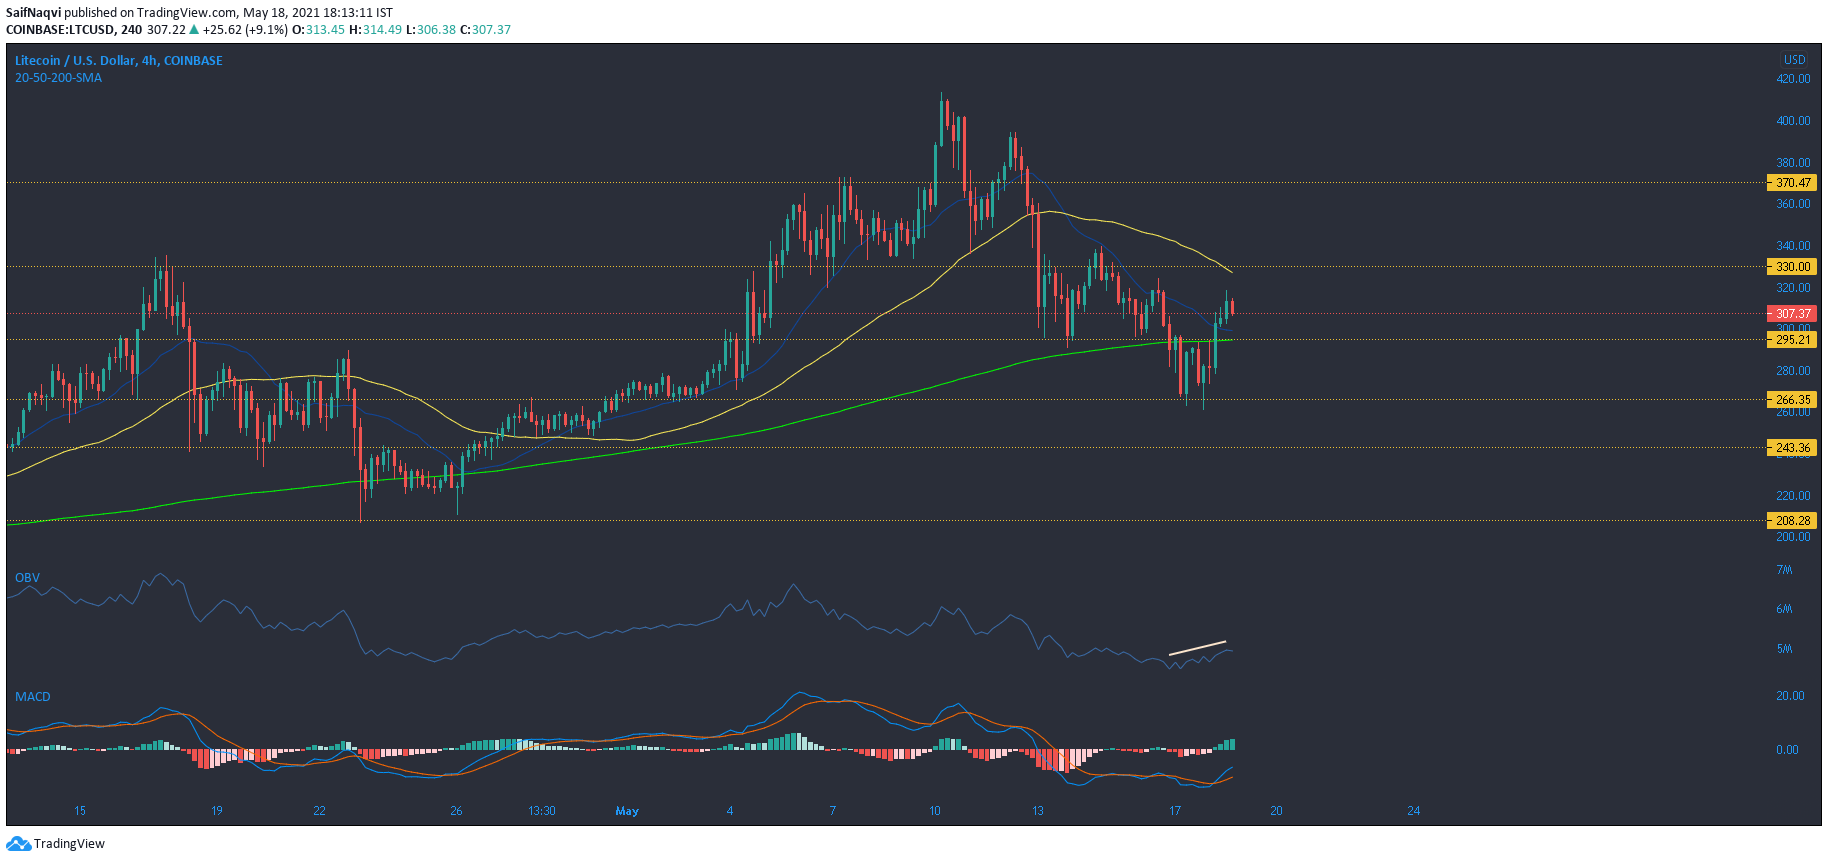
Source: LTC/USD, TradingView
On the 4-hour timeframe, Litecoin made a crucial recovery above its 200-SMA (green) and $295-resistance. This development not only prevented an extended bearish outcome but also opened the doors for a recovery. Moreover, reclaiming the region above $300-330 could even result in a price rally towards $370.
MACD witnessed a bullish crossover as LTC avoided a breakdown from $266-support. A small rise in OBV indicated some buying pressure. Conversely, a bearish outcome could see a fall back towards $243-support- a level last seen in April-end and prior to LTC’s bull run.
Solana [SOL]

Source: SOL/USD, TradingView
A bull flag breakout saw gains of 16% from the upper trendline as Solana snapped an ATH at $55. Fibonacci tool presented some target levels for SOL at $66.3 and $71. However, RSI headed back towards the oversold zone and this could lead to stabilization before the next leg upwards. Trading volumes across exchanges slashed by nearly 30% over the last 24 hours and signaled a halt in buying activity.
Possible levels for a pullback were at 61.8% ($38.47) or 78.6% ($.45.6) Fibonacci levels. A sharper retracement towards 50% Fibonacci level would likely signal the end of SOL’s current rally. Meanwhile, capital outflows remained weak after the Chaikin Money Flow dropped below equilibrium.
Ethereum [ETH]
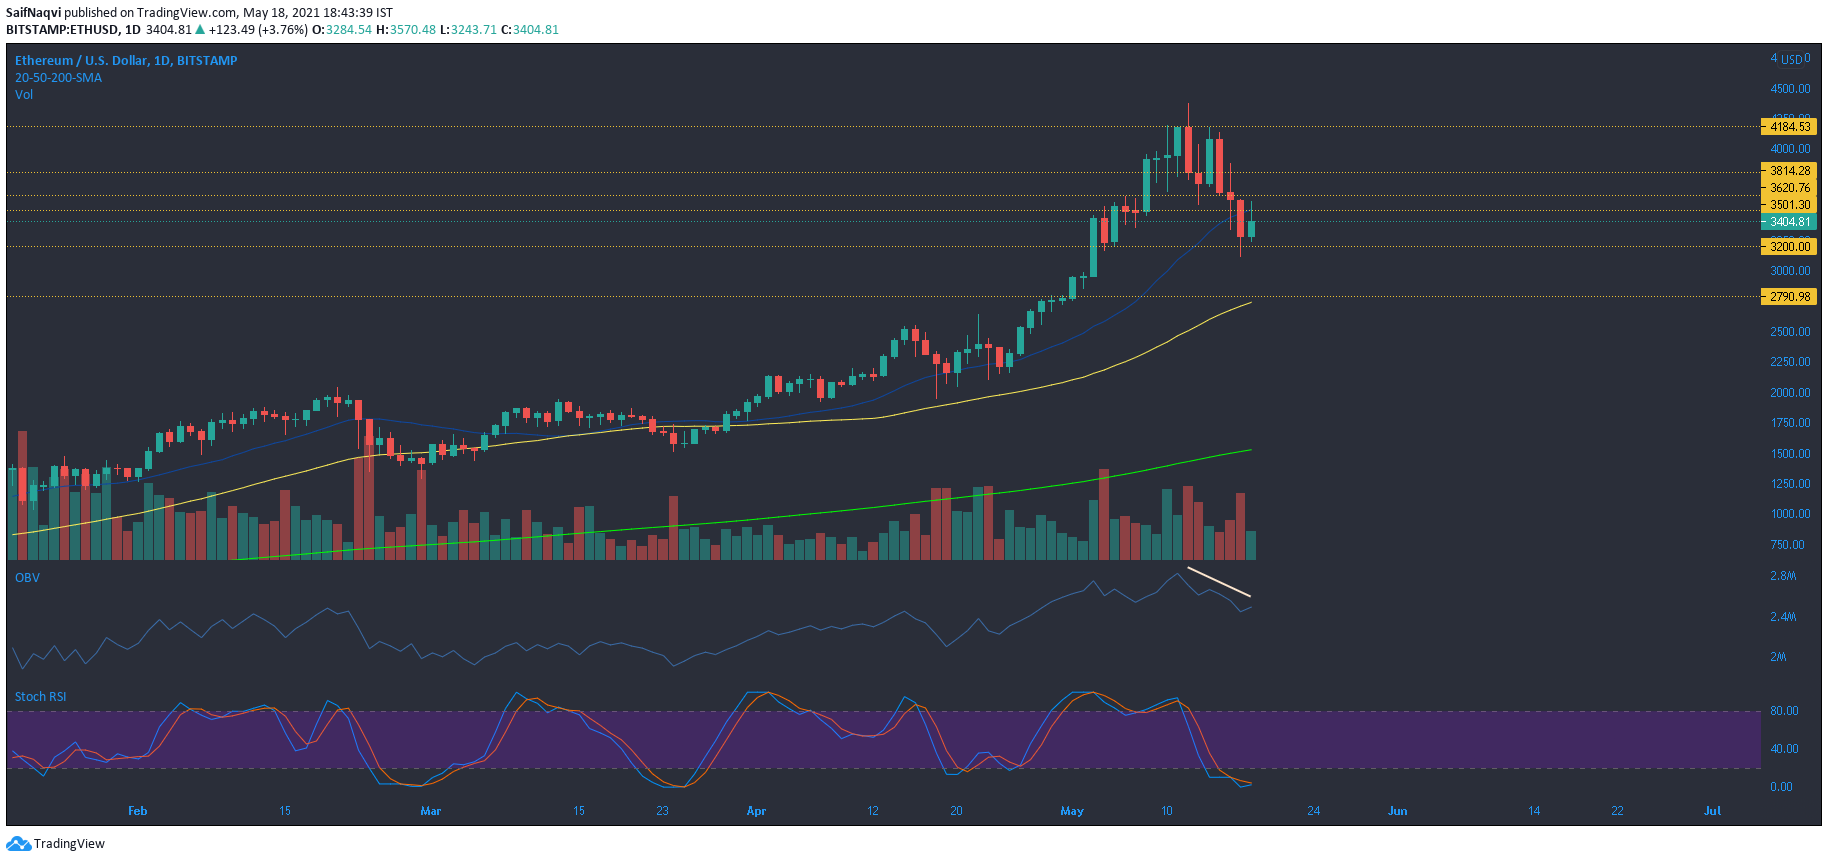
Source: ETH/USD, TradingView
Selling pressure was still a dominant force in the market as Ethereum retraced from a high of $4,380 to a low of $3,117 in just seven days. OBV’s downwards trajectory highlighted profit-taking but overall, the index maintained higher levels. There was some support around $3,200-$3,116 and a breakdown could see another retracement towards $2,800 and the 50-SMA (yellow).
For a swift comeback, ETH needed to reclaim territory above $3,500-$3620. The confluence of this buy zone with the 20-SMA (blue) could fuel the next rise for ETH. A bullish crossover in Stochastic RSI and a rise above 40 could result in a favorable outcome moving forward.