Litecoin’s bulls must look out for these divergences in price action

Disclaimer: The findings of the following analysis are the sole opinions of the writer and should not be considered investment advice
After its latest bullish rally, Litecoin (LTC) finally saw a close above its long-term liquidity range (Point of Control/POC) while rising within an ascending channel (white).
With the 4-hour 50 EMA (cyan) jumping above the 200 EMA (green), the bulls have steered the trend in their favor over the last few days. Now, as the price keeps testing the upper band of the Bollinger Bands (BB), it could see a short-term pullback towards the $115-mark. At press time, LTC was trading at $119.2, up by 4.1% over the last 24 hours.
LTC 4-hour Chart
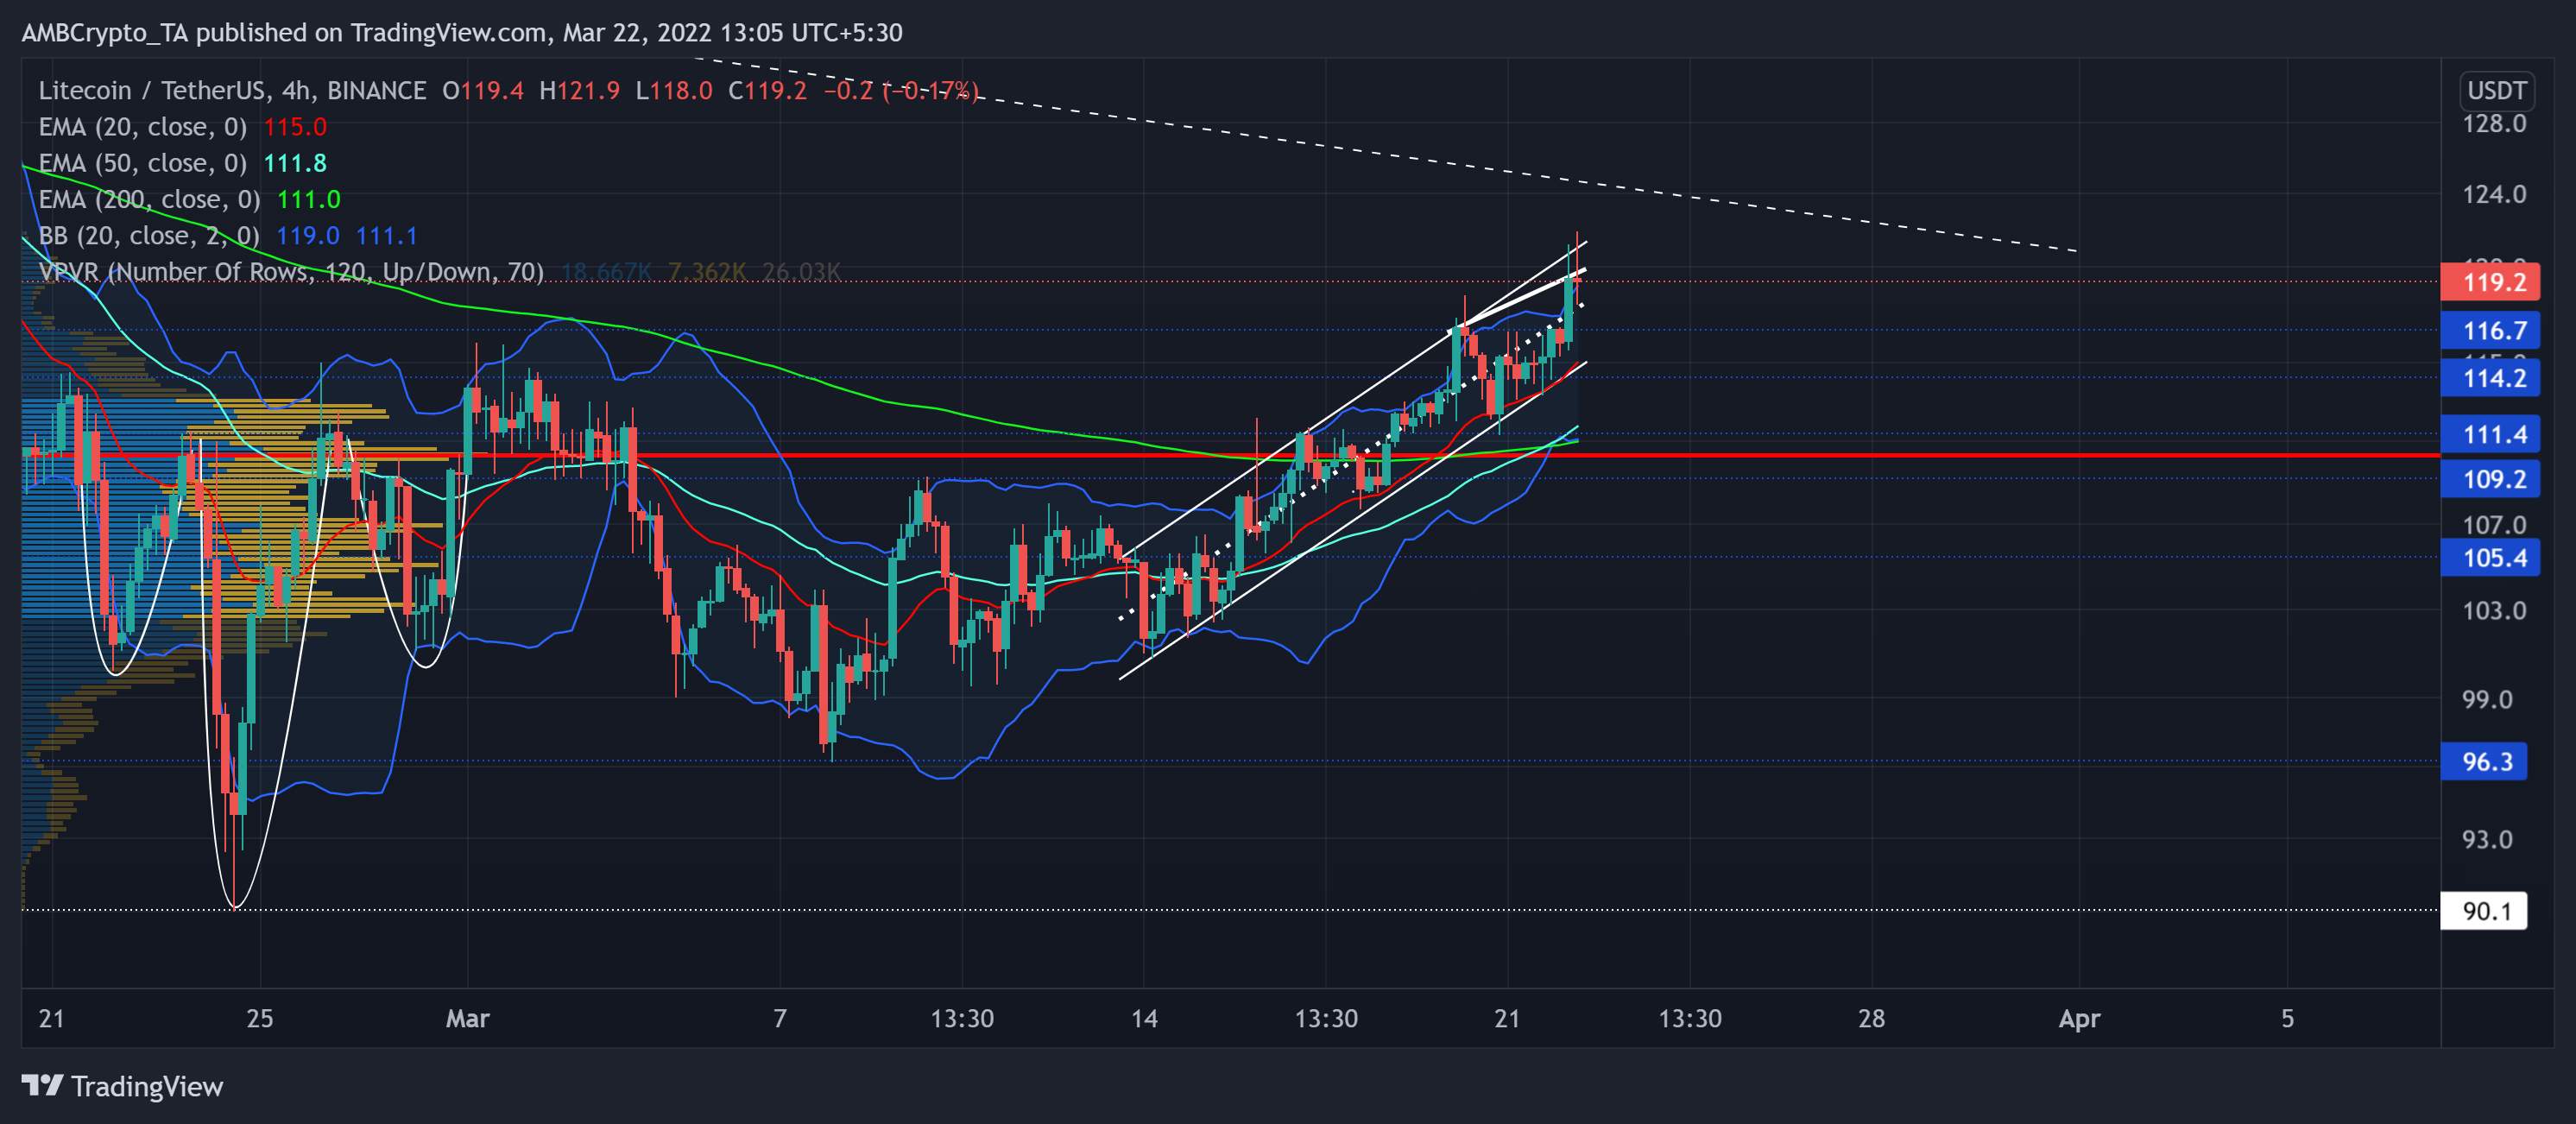
At last, the buyers stepped in at the 15-month-long support near $90. As a result, the altcoin registered over 30% ROI from its 64-week low on 24 February to date.
While recovering from its previous sell-off losses, it found a close above its 20/50/200 EMA. Meanwhile, the 50 EMA undertook a bullish crossover with its 200 EMA. This reading entailed the bulls had taken charge of the trend while they reclaimed the $116-support.
Owing to the overbought readings on its BB, LTC could see a near-term setback towards the lower trendline of its up-channel. Following this, it would most likely continue its up-channel trajectory towards its three-month trendline resistance (white, dashed). Also, with the 20 EMA still looking north, the bulls made it a point to keep the uptrend intact for a while.
Rationale

The RSI hovered near the overbought region while marking lower peaks over the past two days. This reading confirmed the bullish vigor but disclosed a bearish divergence with the price. Thus, affirming the possibility of a near-term pullback before a recovery.
Furthermore, the OBV corresponded with the RSI by bearishly diverging with the price.
Conclusion
Considering the oversold readings on the BB with the divergences on the OBV and RSI, the alt positioned itself for a short-term pullback towards the 20 EMA. Soon after, the bulls might try to maintain their edge and aim for recovery at the $123-zone.
Moreover, LTC shares a 72% 30-day correlation with the king coin. A close eye on Bitcoin’s movement would be imperative to make a profitable move.