Litecoin’s price will pump 20% ONLY IF this pattern pans out for you
Litecoin’s price was moving inside a bull pattern. Here's what it means really...
- Metrics suggested that LTC was undervalued on the charts
- Technical indicators were bearish on Litecoin
Like most cryptocurrencies, Litecoin’s [LTC] price remained under bears’ control last week because of the market conditions. However, if the latest data is to be considered, then LTC might soon showcase a bullish performance if it manages to test a pattern that has formed on its chart.
Litecoin is shedding value
AMBCrypto reported a few days ago how Litecoin’s price surged by nearly 10% to lead the altcoin market rally during that day’s intraday trading session. However, the trend didn’t last long, as the bears soon buckled and pushed the coin’s value down.
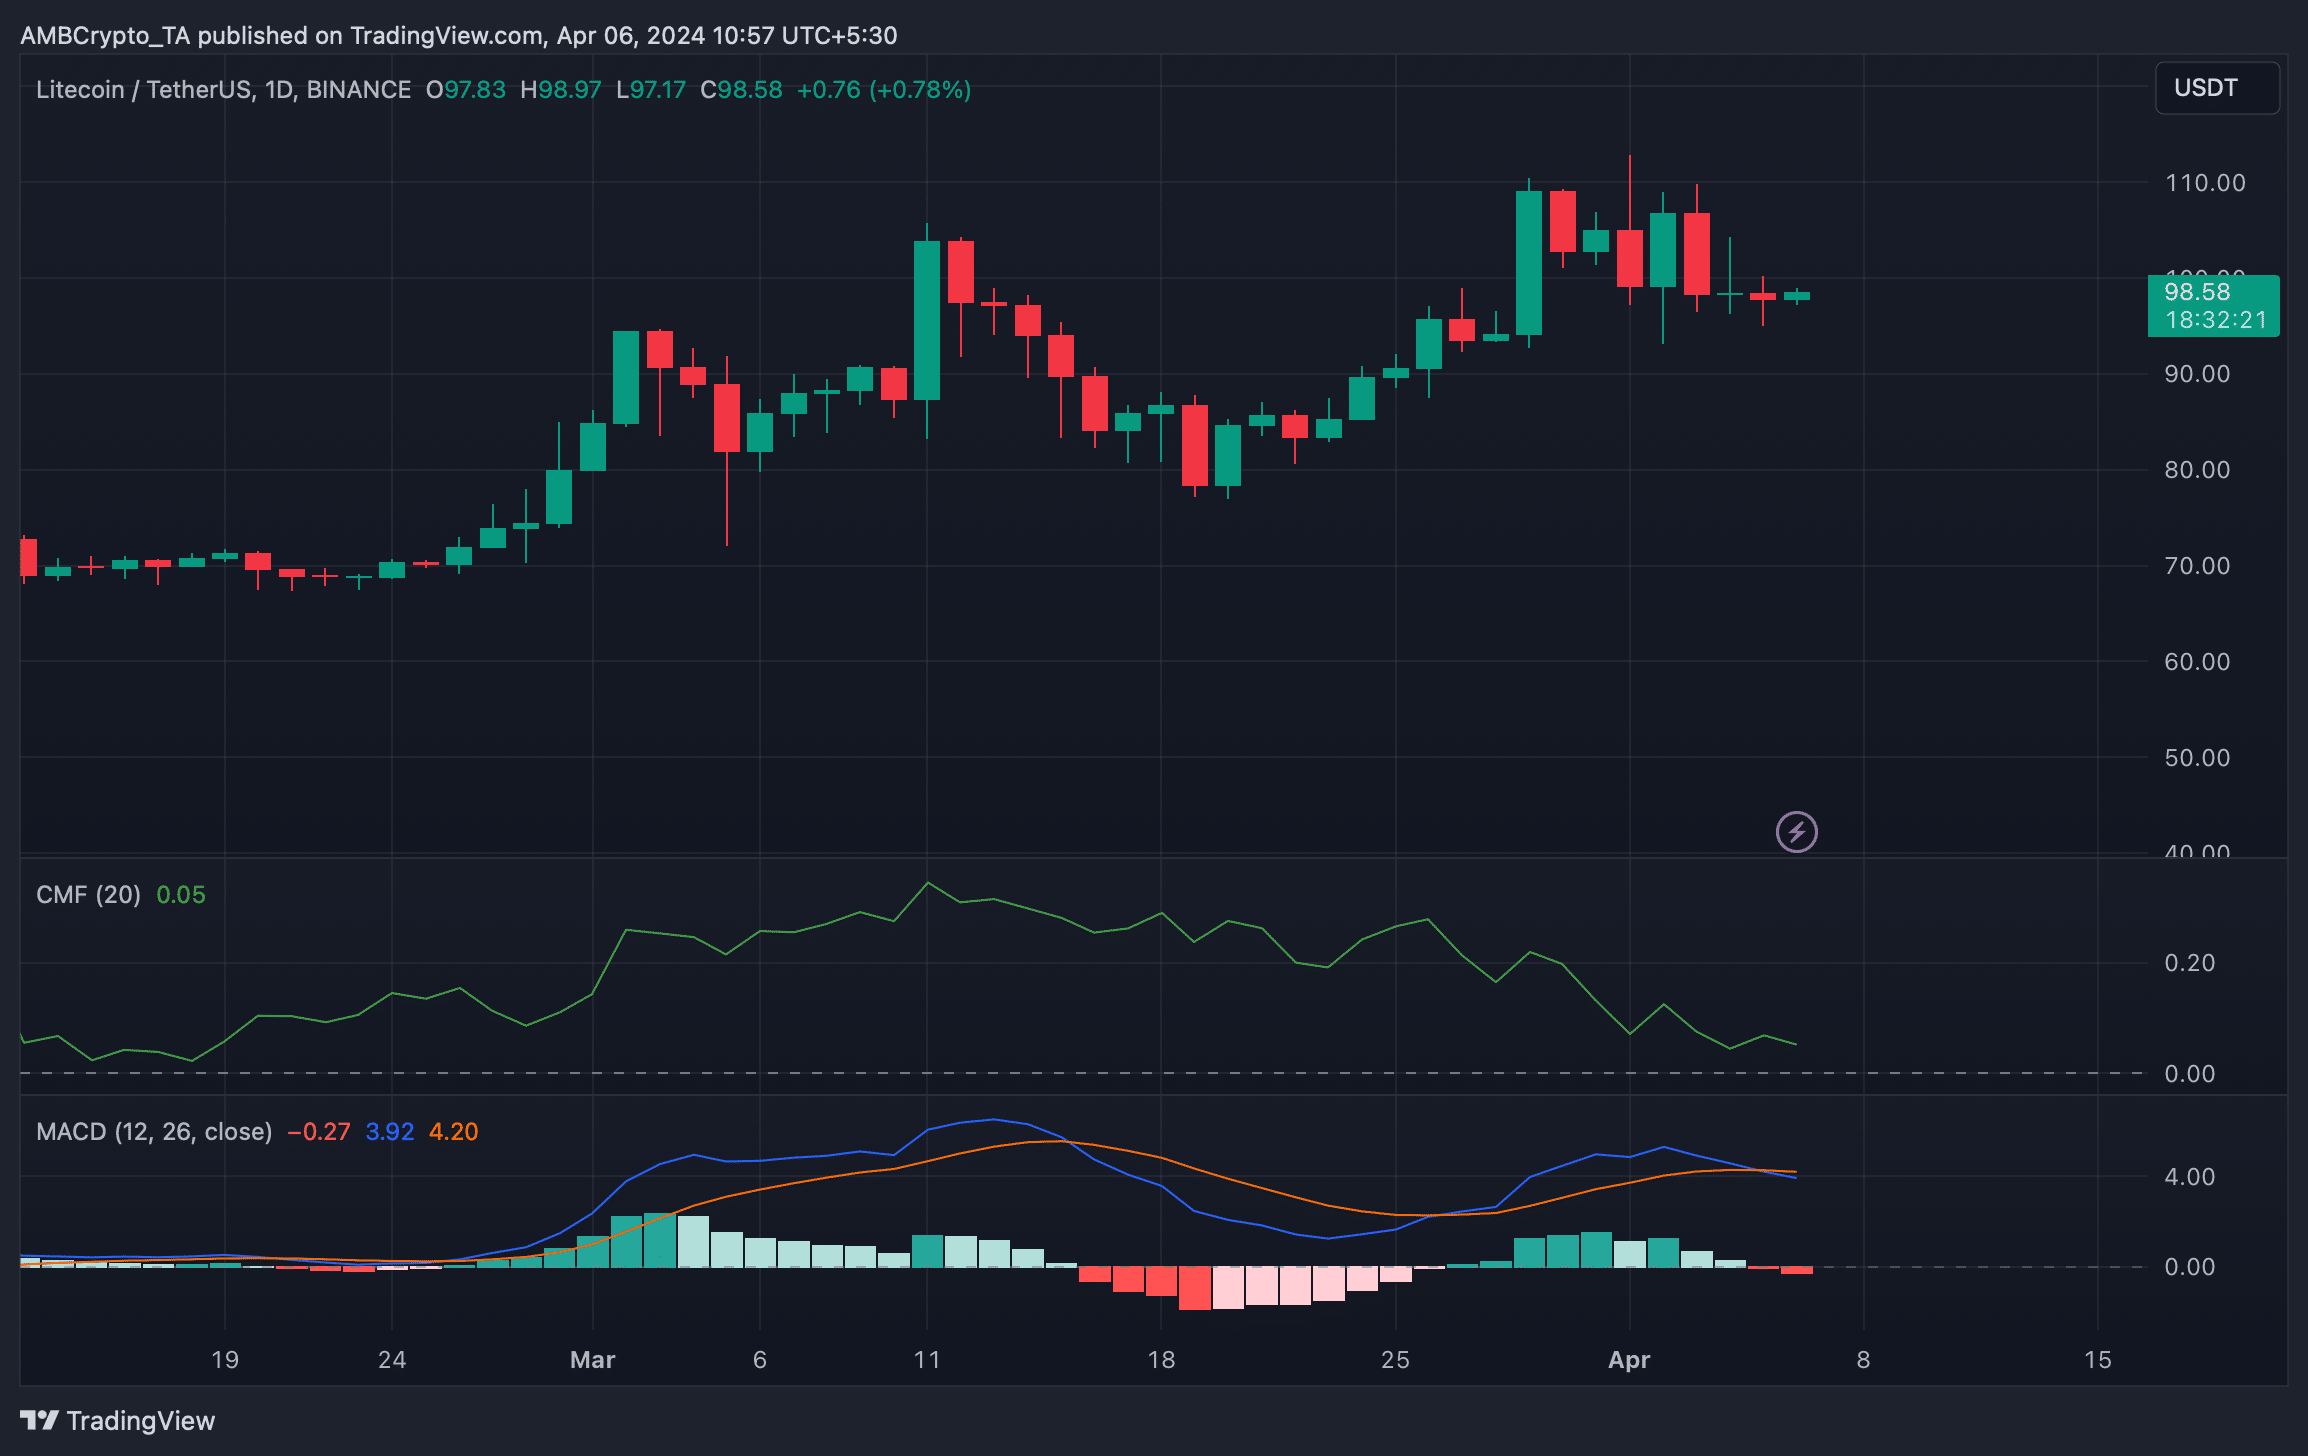
According to CoinMarketCap, LTC’s value plummeted by more than 5.5% in the last seven days. However, the altcoin showed some signs of recovery as its value moved up marginally in the last 24 hours. At the time of writing, LTC was trading at $98.80 with a market capitalization of over $7.34 billion, making it the 20th largest crypto on the charts.
In fact, World of Charts, a popular crypto-analyst, recently shared a tweet highlighting a bull pattern that formed on LTC’s chart. According to the same, LTC’s price was moving in a bullish pennant pattern. A breakout above that pattern could allow LTC to pump its price by more than 20% in the coming days.
Is a bull rally inevitable?
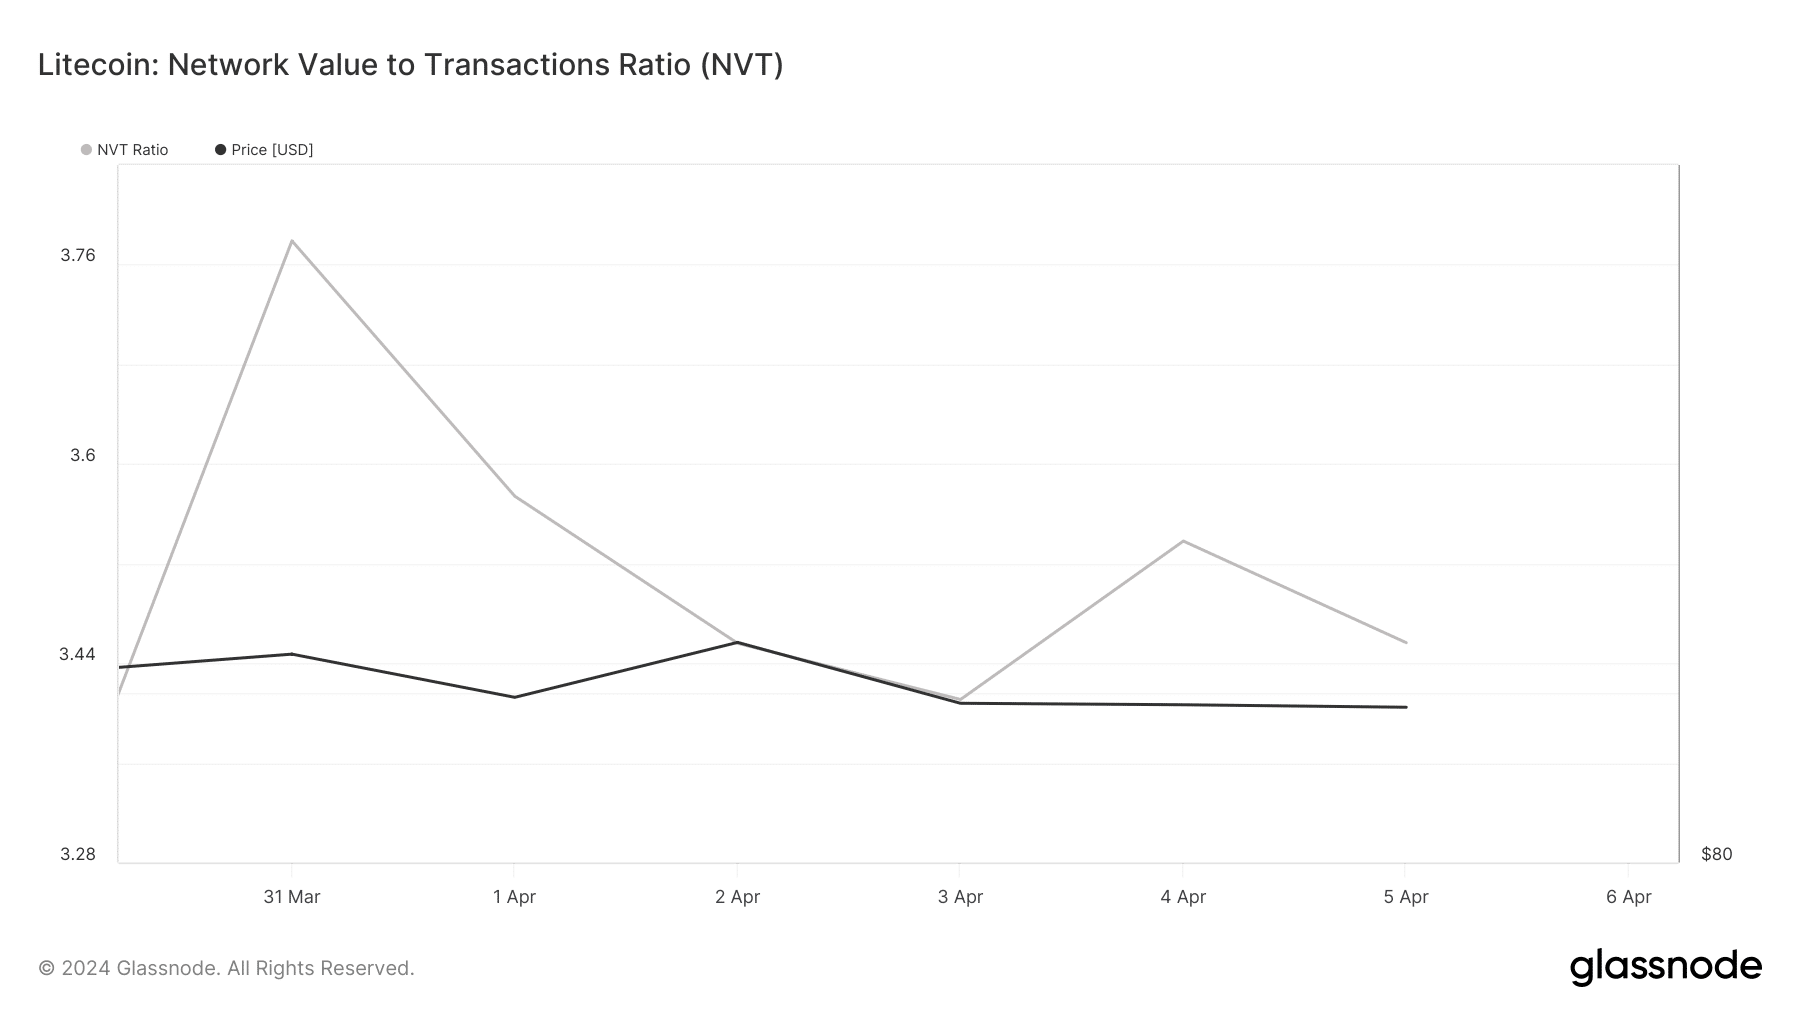
Since LTC’s price was moving inside a bull pattern, AMBCrypto checked the coin’s metrics to find how likely it is for LTC to break above that pattern. Our analysis of Glassnode’s data revealed that LTC’s network-to-value (NVT) ratio remained low. A drop in this metric means that an asset is undervalued, underlining the high possibility of a price uptick.
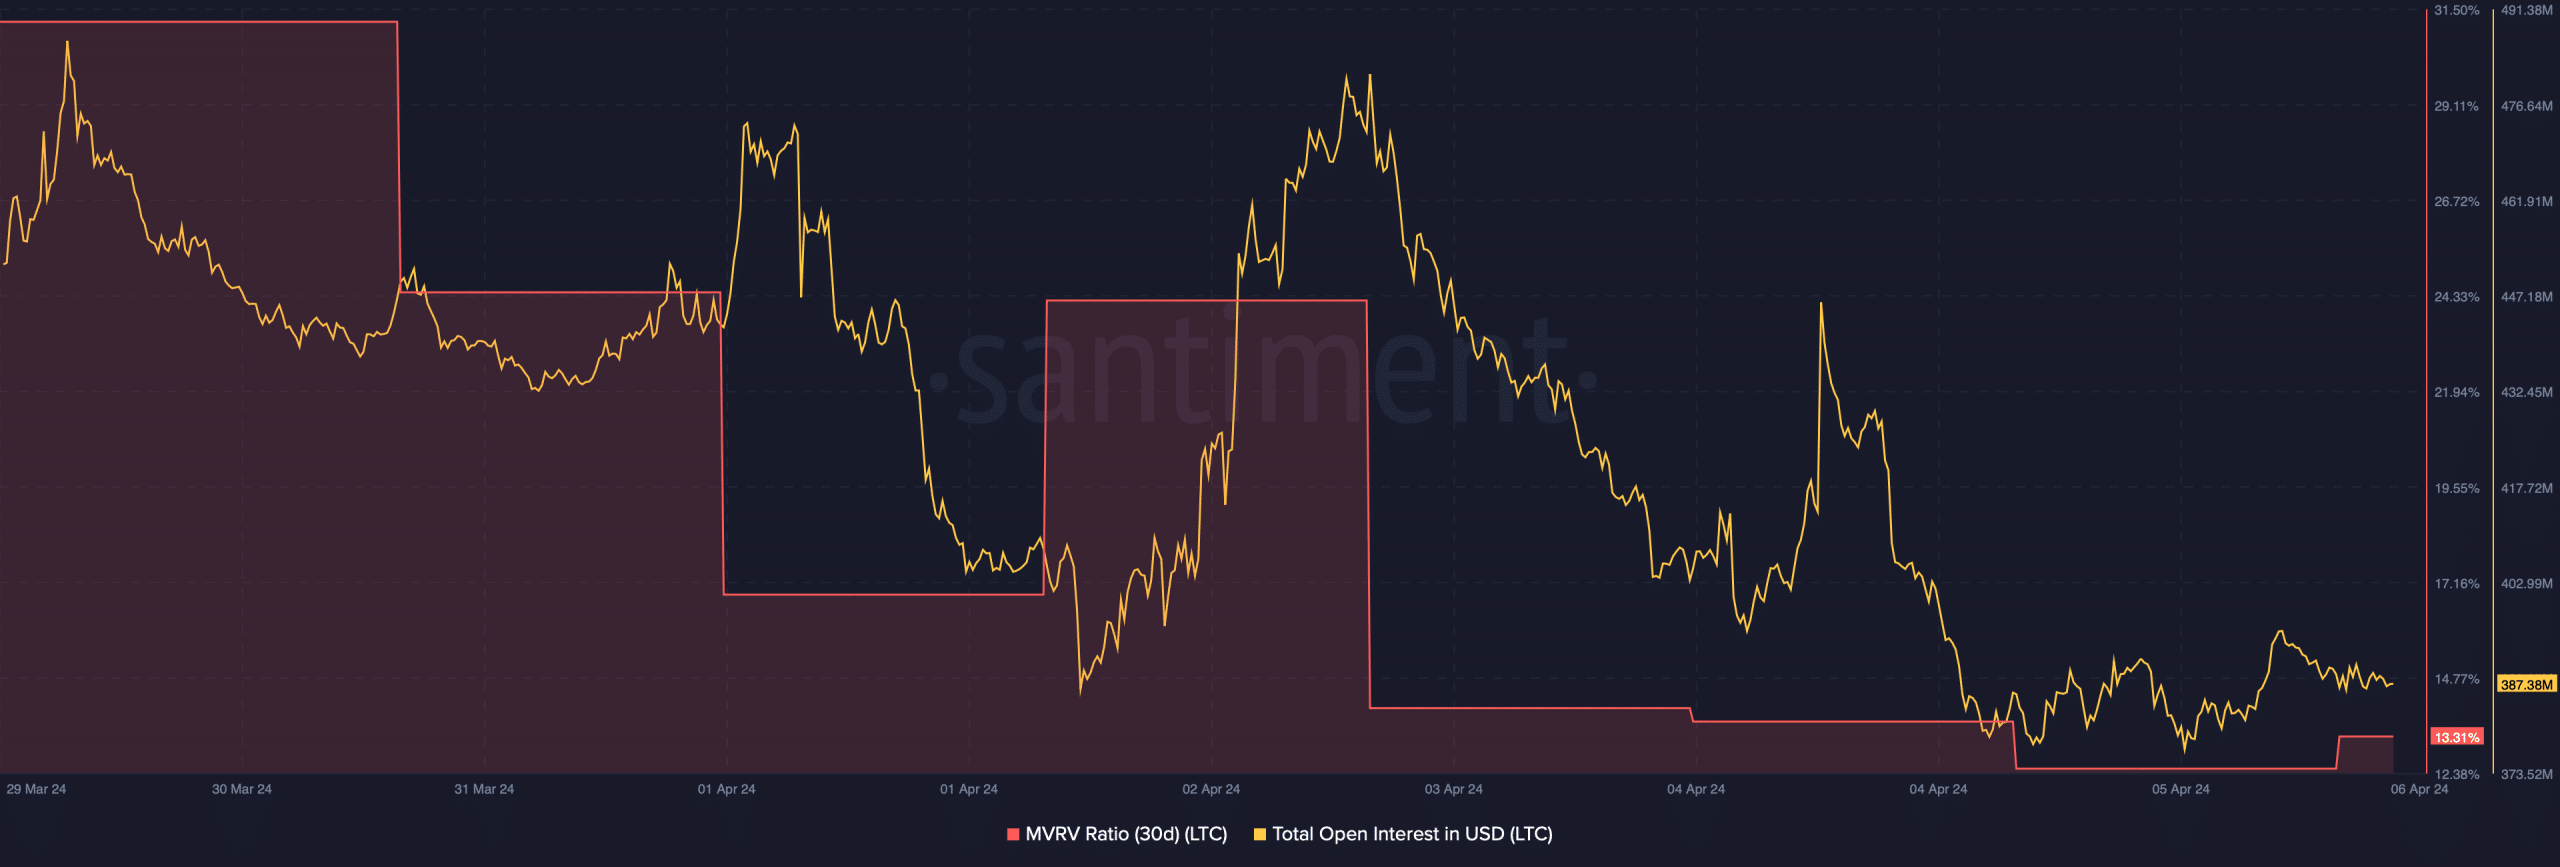
Additionally, the altcoin’s open interest also dropped alongside its price. This is also a bullish signal as a decline in open interest is a sign that chances of the ongoing price trend changing are high. Nonetheless, Litecoin’s MVRV ratio was down sharply. At press time, it had a value of 13.3%, which indicated that LTC might not be able to initiate a bull rally.
Read Litecoin’s [LTC] Price Prediction 2024-25
To better understand whether LTC would touch $100 in the near term, AMBCrypto then analyzed its daily chart. We found that the technical indicator MACD flashed a bearish crossover. Its Chaikin Money Flow (CMF) also registered a downtick, signaling sustained price decline.
As most of the market indicators have been bearish lately, it will be interesting to see whether the bullish metrics translate into a price uptick and allow LTC to climb in the coming days.