Loopring could see further losses as sellers were too strong at a crucial juncture

In February 2021, Loopring was trading beneath the $0.87 resistance level, and in July 2021 the price had dropped to $0.17. Later, in November, Loopring grew to trade at $3.6, and in the months since, the price has heavily retraced. This long time horizon gives us some context on the importance that the $0.8-$0.9 area has been held in the past. At the time of writing, LRC was once more knocking on the $0.87 support level. The near-term bias for the coin appeared to be bearish.
LRC- 1H
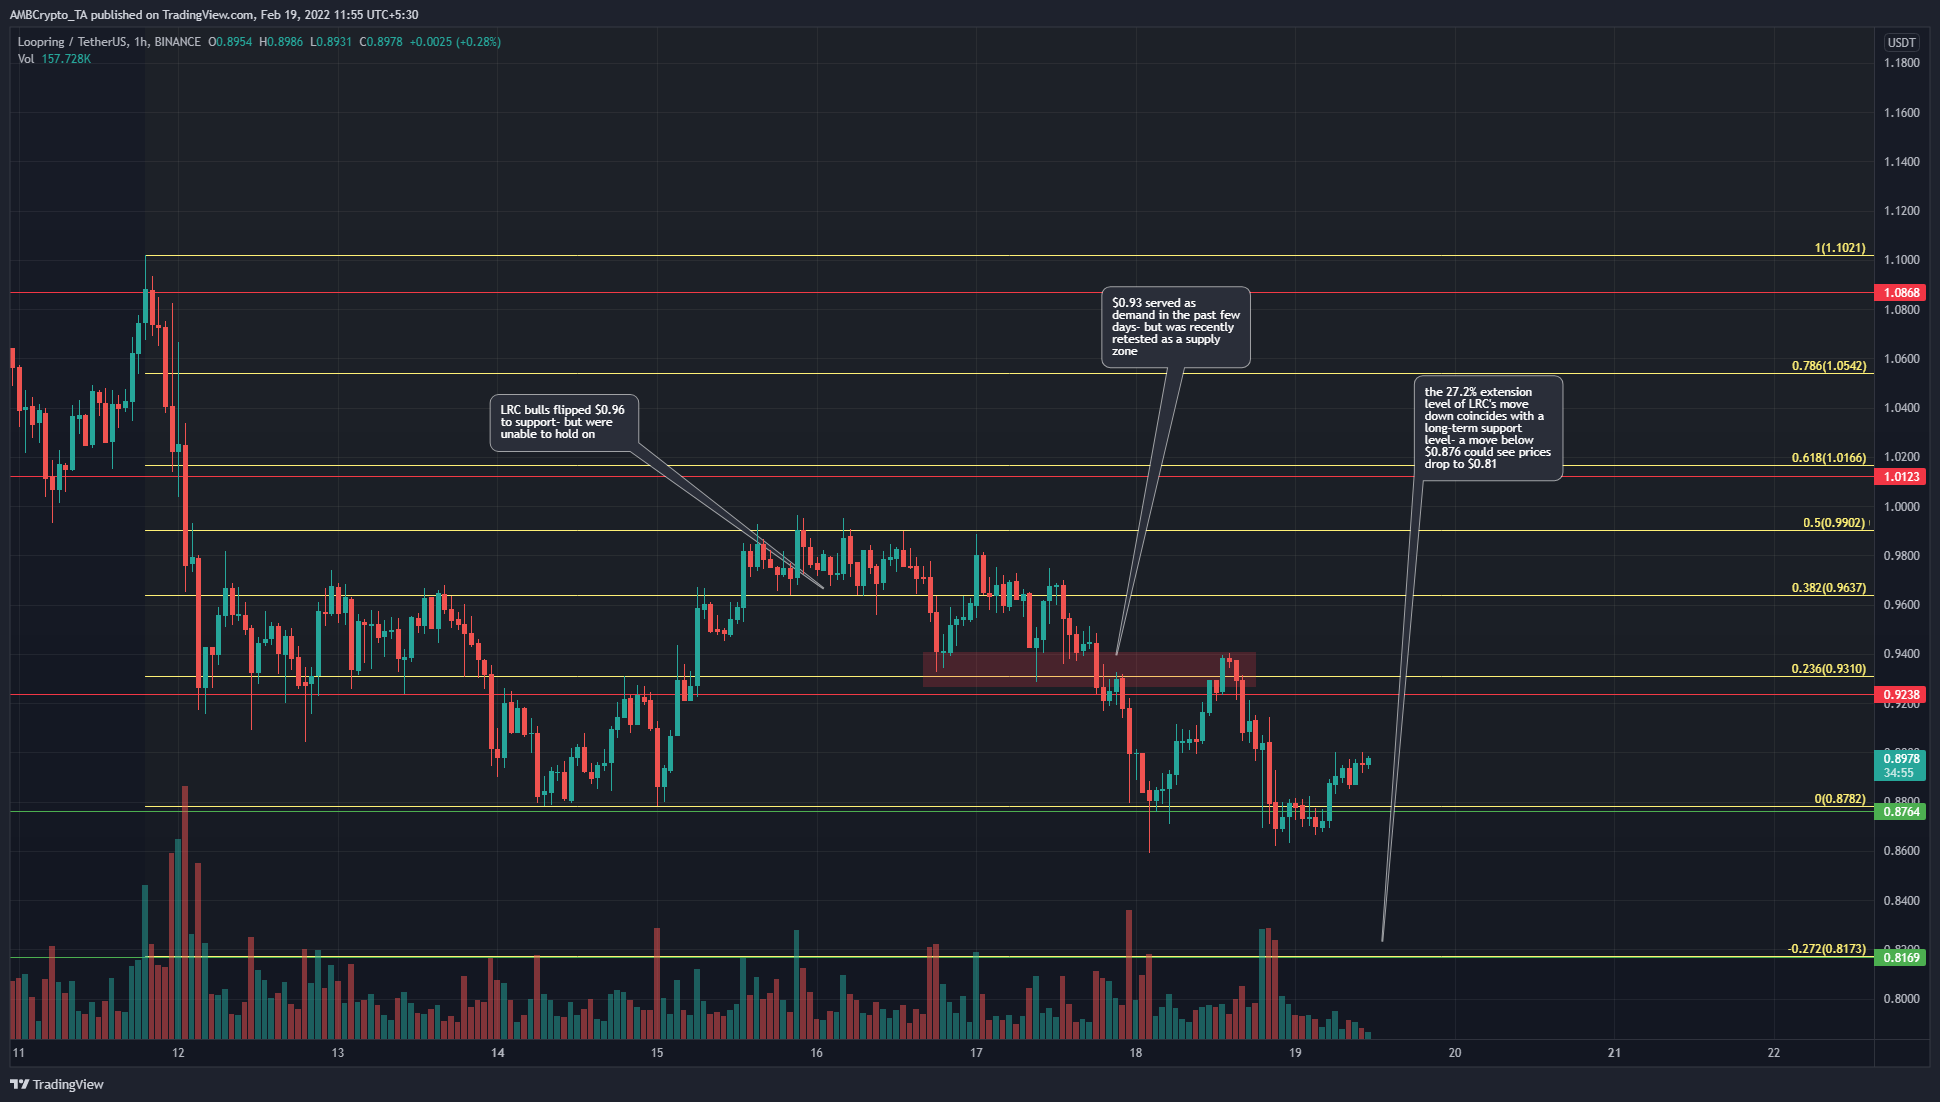
Using the swing high and swing low at $1.1 and $0.878, a set of Fibonacci retracement levels (yellow) was plotted. Earlier this week, the 50% retracement level at $0.99 had acted as resistance, and the price was rejected from $0.99. For a brief time, the $0.93 area (red box) acted as a demand zone- but the bulls in this area were quickly exhausted.
Subsequently, the price retested this area from below to confirm its flip to a supply zone. This suggested that the $0.92-$0.93 area, even on a retest, would likely still be dominated by sell orders.
A bullish scenario would be a weekend move above $0.93 for LRC, but this was unlikely as demand was not really present. The more likely scenario for LRC in the days to come was a move lower, to the $0.81 support level. This level was also the 27.2% Fibonacci extension level.
Rationale
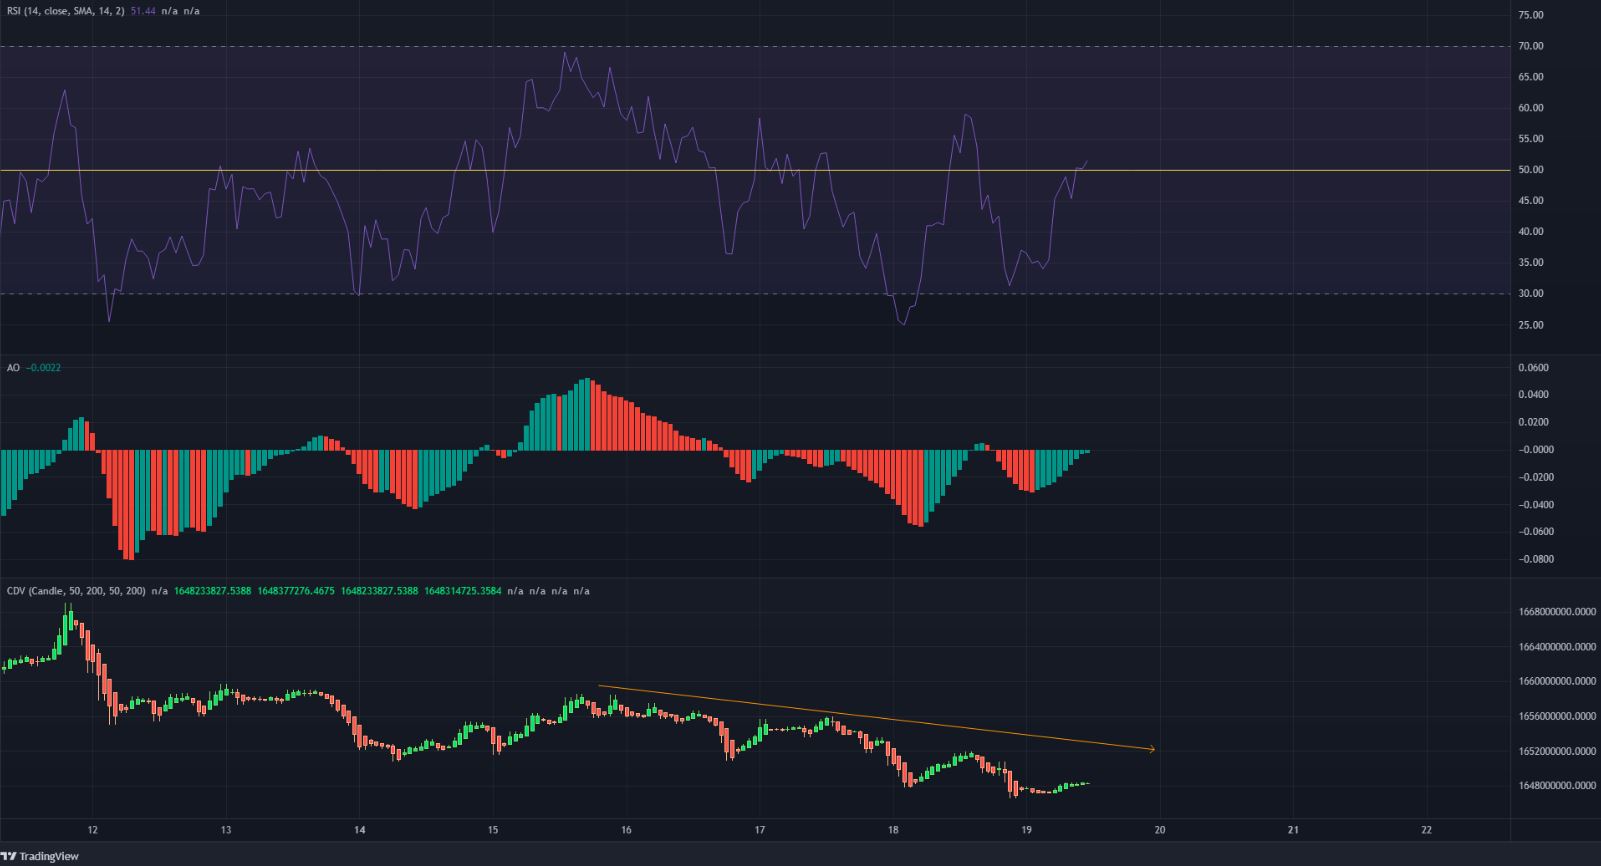
The RSI poked its head above the neutral 50 lines timidly, while the Awesome Oscillator was also on the verge of climbing above the zero line. This indicated that bearish momentum had, at least temporarily, been stalled.
However, the CDV showed that selling volume has been steady in the past few days. The bounce from the $0.86 area in recent hours did not have notable buying volume.
Conclusion
The market structure was bearish, and the $0.93 area was confirmed to be a supply zone in the past few days. Due to the lack of demand for LRC recently, a move further south to $0.81 could materialize in the next few days.
Disclaimer: The findings of this analysis are the sole opinions of the writer and should not be considered investment advice