LTC displays firm bullish bias. Here’s why short sellers could profit soon…

Disclaimer: The information presented does not constitute financial, investment, trading, or other types of advice and is solely the writer’s opinion.
- Litecoin has a bullish bias on the four-hour price chart
- The lack of buying pressure meant LTC longs must be cautious
Litecoin [LTC] has traded within a range since the latter half of August. Despite the recent bullish conditions, LTC was unable to clear a higher timeframe resistance zone. Its high positive correlation with Bitcoin [BTC] suggested that the coin has plenty of room to rally higher.
Read Litecoin’s [LTC] Price Prediction 2023-24
A recent report by AMBCrypto noted that LTC could climb to $65 before a bearish reversal. This did not come to pass due to the enormous BTC rally, but the highlighted resistance zone up to $74 remained unbeaten.
The range high is now a support level, but bulls should temper enthusiasm with caution
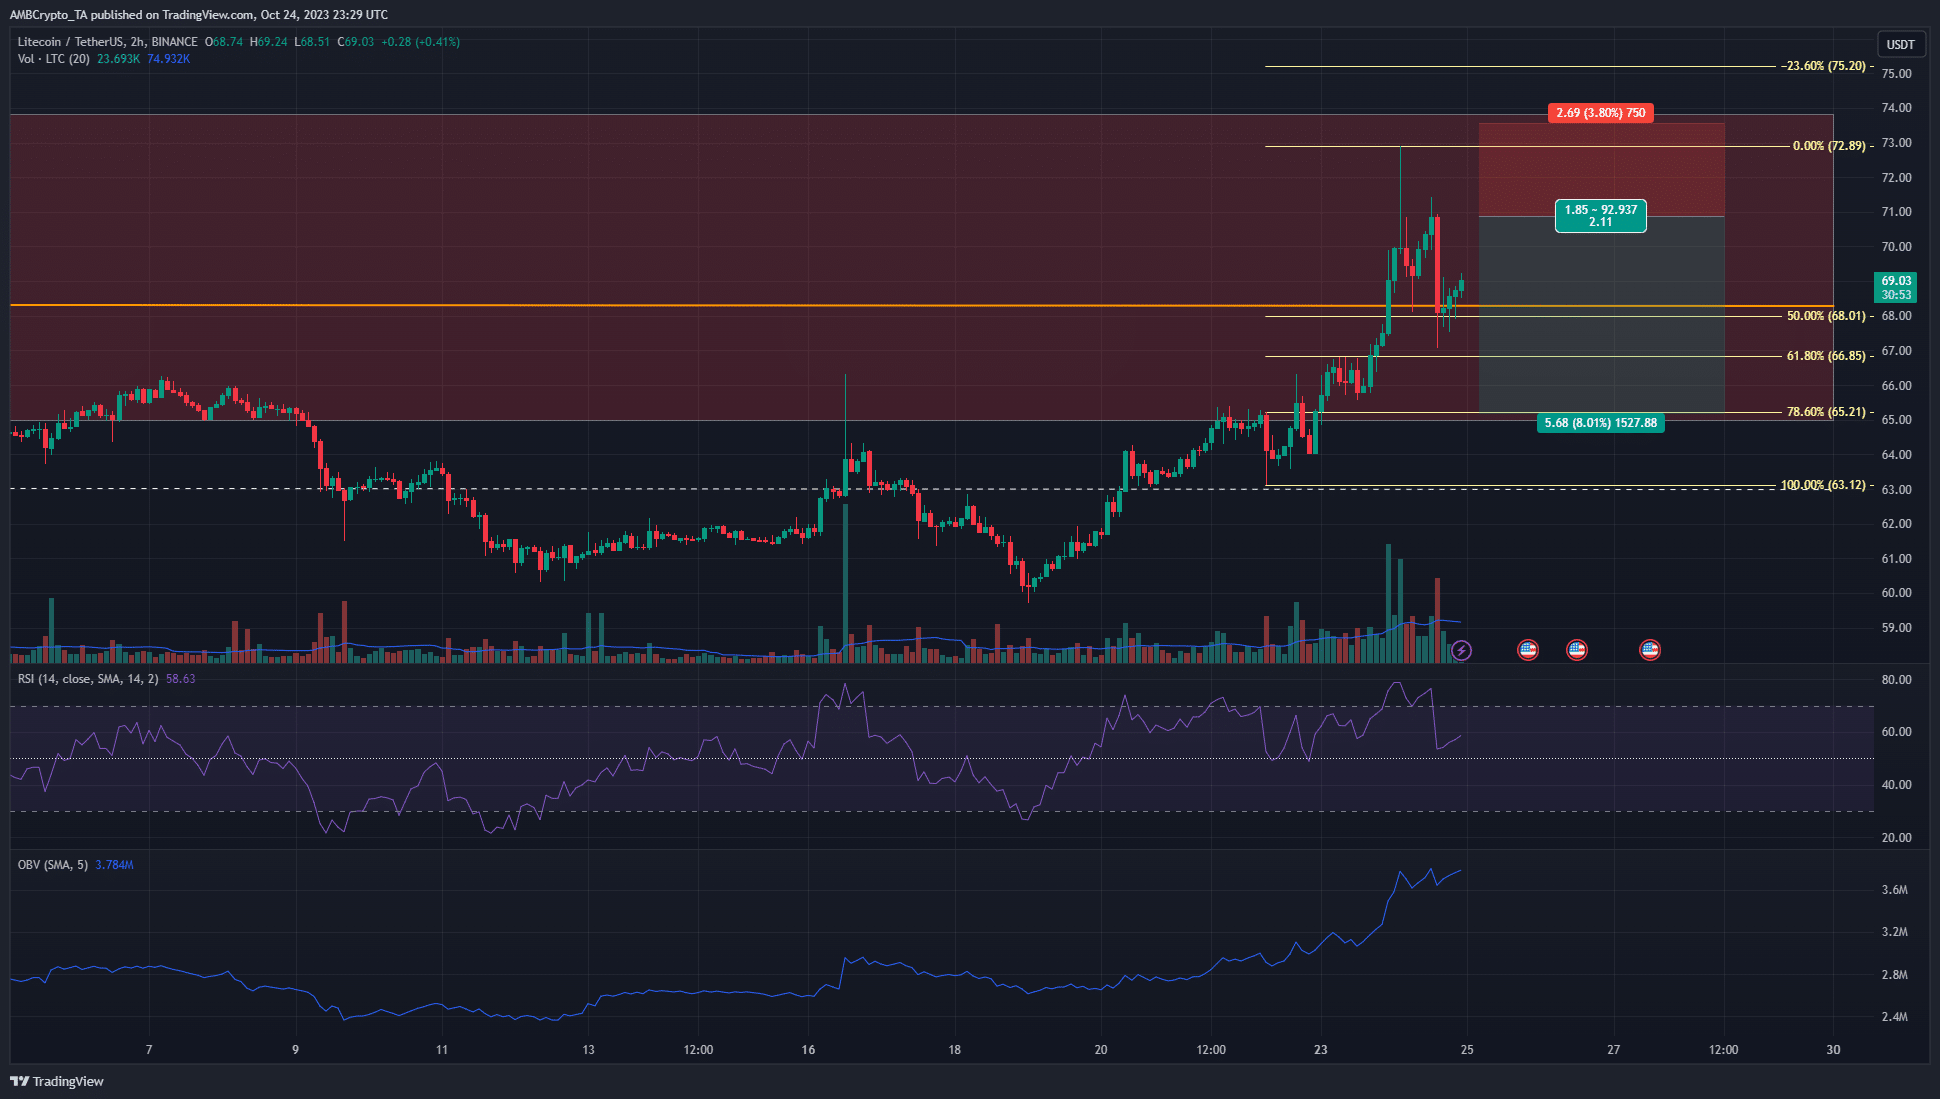
Many altcoins saw double-digit percentage gains this week and heavy buying pressure. Litecoin was among them, but the demand for the coin was suspect. True, the OBV was in a steady uptrend over the past week.
The H4 market structure was bullish and the Relative Strength Index (RSI) was above 50 to reflect an uptrend and bullish momentum. Yet, there were some signs of weakness in the market. For starters, LTC saw a sharp rejection at the $72.89 level and fell as far south as $67.07. It was an 8% drop, but the Fibonacci retracement levels indicated that bulls need not be worried yet.
The daily bearish breaker block (red box) that extended up to $74 did not see a trading session close above it yet. Until then, long-term bulls could be justified in their misgivings.
The spot CVD is a large contributor to the bearish notions highlighted above

Source: Coinalyze
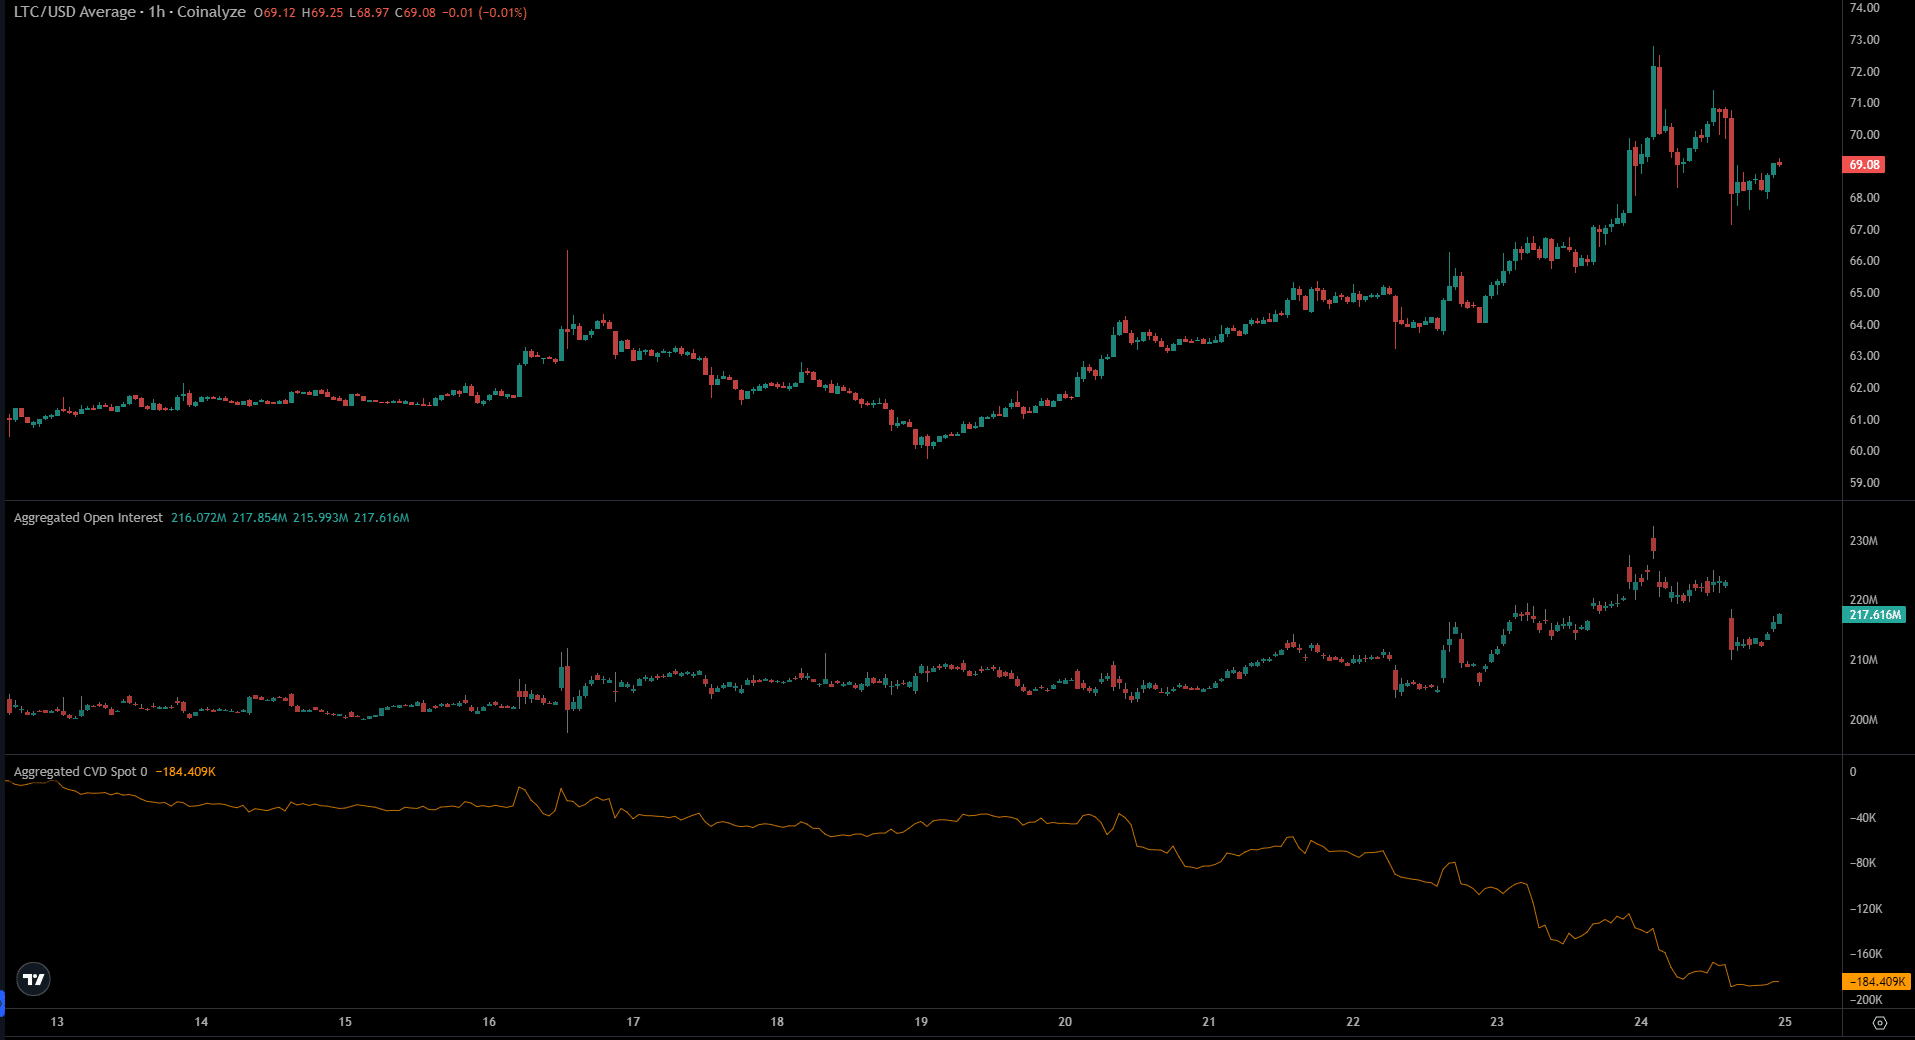
The data from Coinalyze noted strong bullish sentiment as the Open Interest (OI) and the prices climbed from 21 October to 24 October. The pullback saw the OI drop, which wasn’t a worry as it’s normal for the market to ebb and flow.
What is abnormal is the strong downtrend on the spot Cumulative Volume Delta (CVD) over the past week. This meant that the recent move to $73 was borne by the futures market and not the spot market, which meant a reversal was likely.

Source: Hyblock
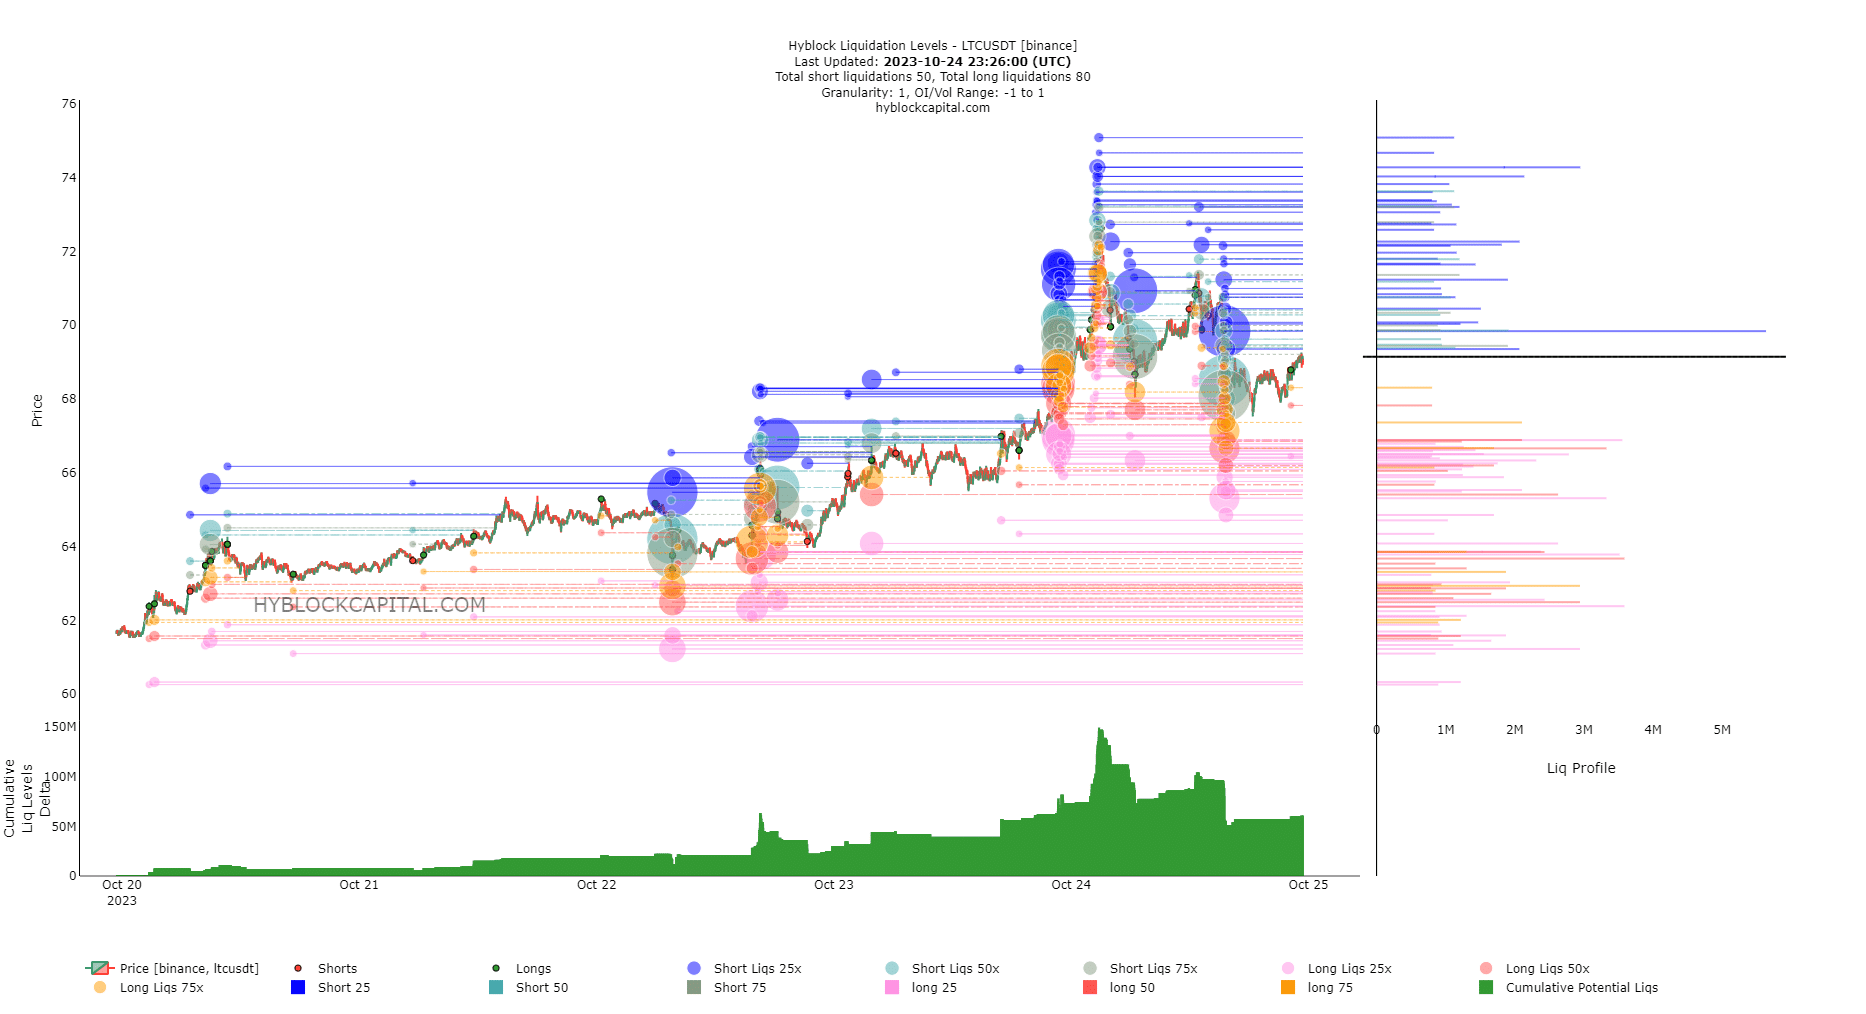
Hyblock data showed a positive Cumulative Liq Levels Delta. The recent pullback from $72 saw some long positions liquidated, which brought this Delta down. The liquidation levels chart showed that millions of dollars worth of shorts could get liquidated in the $70-$72.15 zone.
Is your portfolio green? Check the Litecoin Profit Calculator
Therefore, we could get another move toward the $73 mark to hunt these short positions before a reversal. The expectation of a reversal comes from the downtrend on the spot CVD. On the other hand, a BTC move above $36k could see LTC rally alongside it.


