LUNC: Week-long uptick fizzles out – what’s going on?
LUNC witnessed the liquidation of over $300,000 in open long positions. However, the token's strength in maintaining its current momentum is something to watch out for.

- Long-positioned traders took the baton of liquidation from shorts.
- Amid bearish tendencies, the ADX could keep LUNC’s price higher.
After witnessing a period of positive price movement, Terra Classic [LUNC] traders, who were enthusiastic about another increase in value, were left in regret. According to Coinglass, LUNC’s long liquidations reached $302,280 on 5 June.
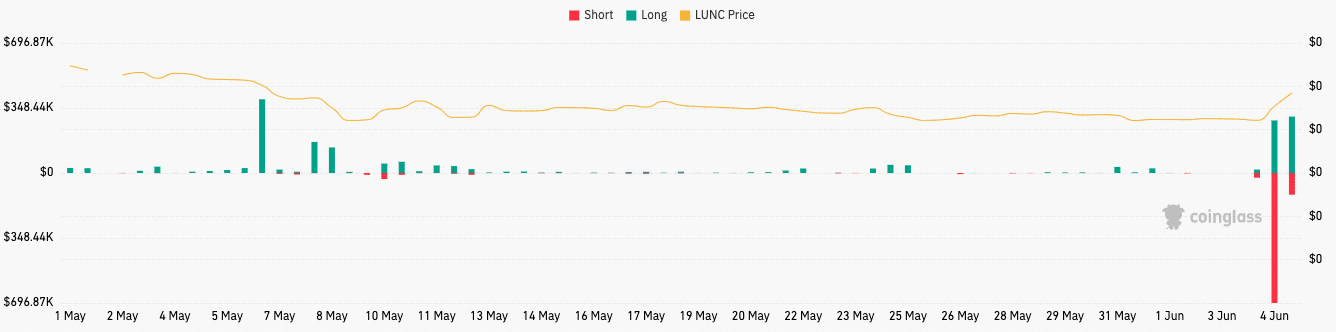
Over the past week, LUNC emerged as one of the biggest gainers alongside Ripple [XRP]. But the upward momentum in LUNC’s price faded in the last 24 hours. However, this decline has only been minimal.
Open Interest abode at the peak
The increase in LUNC’s value resulted from a recent decision by Binance and a surge in the token’s trading volume.
In an official announcement on 1 June, the world’s largest exchange revised leverage positions on its platform. This led to the closure of all open positions on the USDⓈ-M 1000LUNCBUSD Perpetual Contract.
However, data from the derivatives portal showed that the LUNC Open Interest (OI) has maintained its increase. The OI is the total number of outstanding futures or options contracts that are yet to be settled.
If the OI increases, it means that more liquidity is flowing into a contract. But when it decreases, it is a sign that traders are closing their positions. Thus, LUNC’s position aligns with the former.
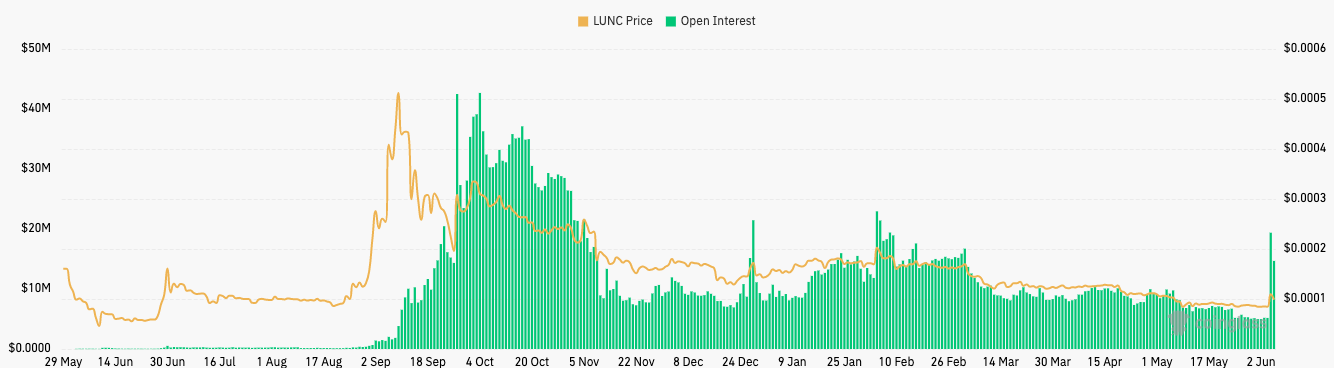
The trend has the potential to act as a strength for LUNC’s press time direction. But the token could be faced with some drawbacks, per the daily chart.
LUNC: Not down, not out
At the time of writing, the Bollinger Bands (BB) showed that LUNC’s volatility had subsided. So, sudden price spikes or declines might not occur soon.
However, the price touched the upper band at $0.000098. When this happens, it suggests that the token might be overbought. Hence, the trend could retrace as might already be in the process, as shown by the sharp red candle.
Direction-wise, LUNC exhibited signals of an increased uptrend. At press time, the Directional Movement Index (DMI) had the positive (green) in a far higher position than the -DMI (red).
Realistic or not, here’s LUNC’s market cap in BTC terms
With the Average Directional Index (ADX) – in yellow – at 42.24, LUNC’s uptick had the tendency to continue.
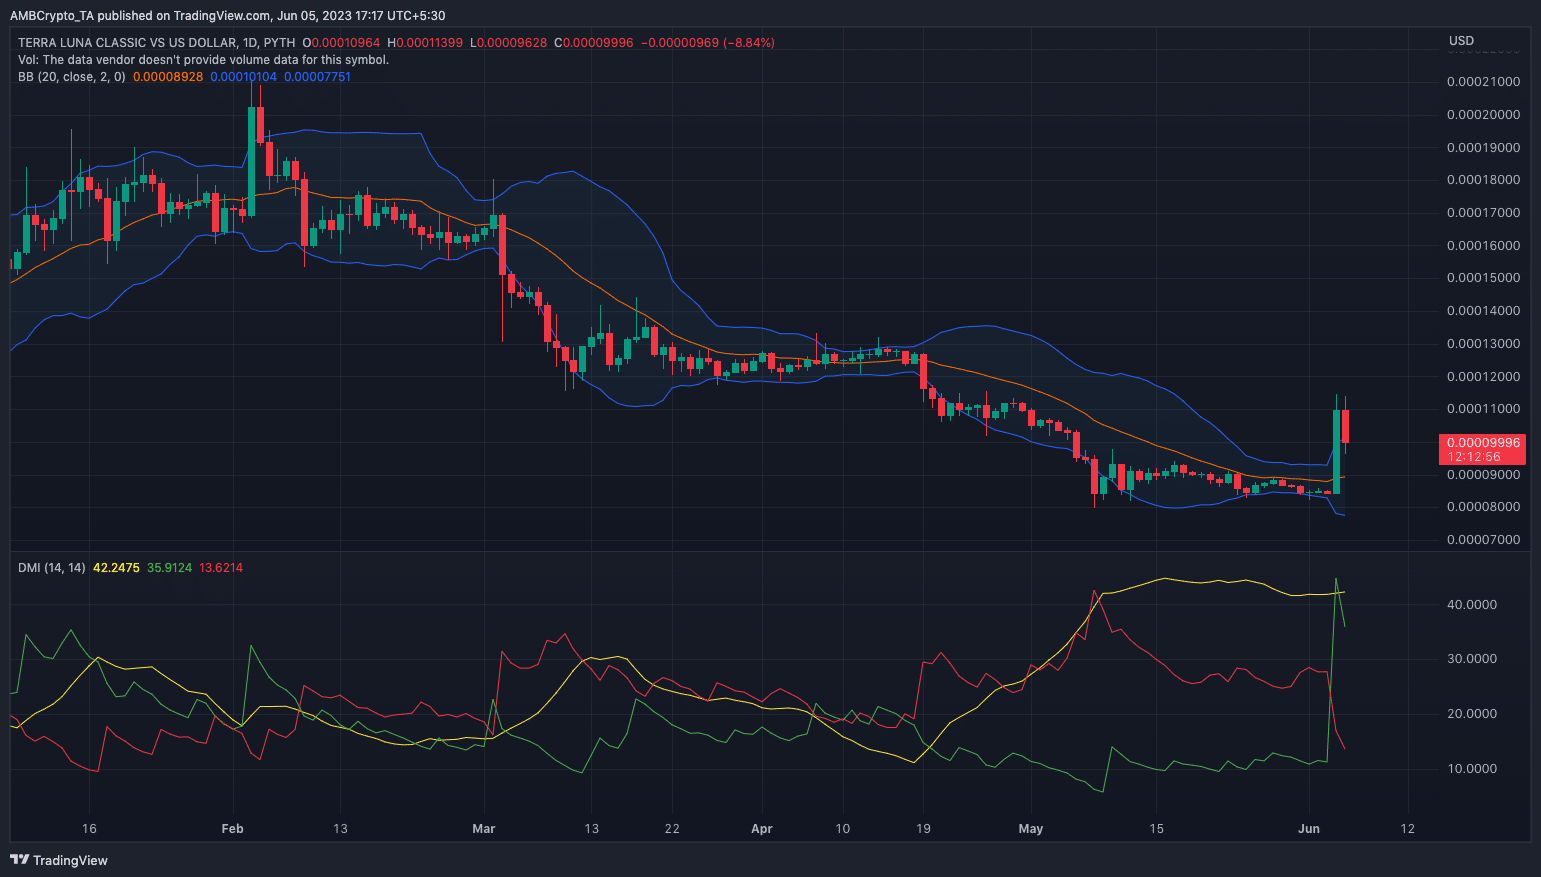
Usually, when the ADX (yellow) rises above 25, it indicates a strong directional movement. Conversely, a value below the threshold could show a shift in sentiment and a potential short-term bearish outlook for the token.