Maker – Assessing whether a buying chance is in the picture now
Maker's long-term price action was on a downtrend but the pullback faced a key obstacle at $1300...

Disclaimer: The information presented does not constitute financial, investment, trading, or other types of advice and is solely the writer’s opinion
- MKR was down 15% after dropping from $1600 to a press time value of $1350
- MKR’s long-term price trend was negative and offered sellers a market edge
Maker [MKR] dropped 15% from its 2023 high of $1600 to a press time value of $1350. However, the pullback faced a key price imbalance and a bullish level that could make it attractive to buyers.
Is your portfolio green? Check out the MKR Profit Calculator
Bitcoin [BTC] dropped below $27k and exerted more bearish pressure across the crypto-market on 11 October.
However, a key price imbalance on MKR’s price chart held further bearish pressure, as of press time.
Will the pullback stop at these levels?
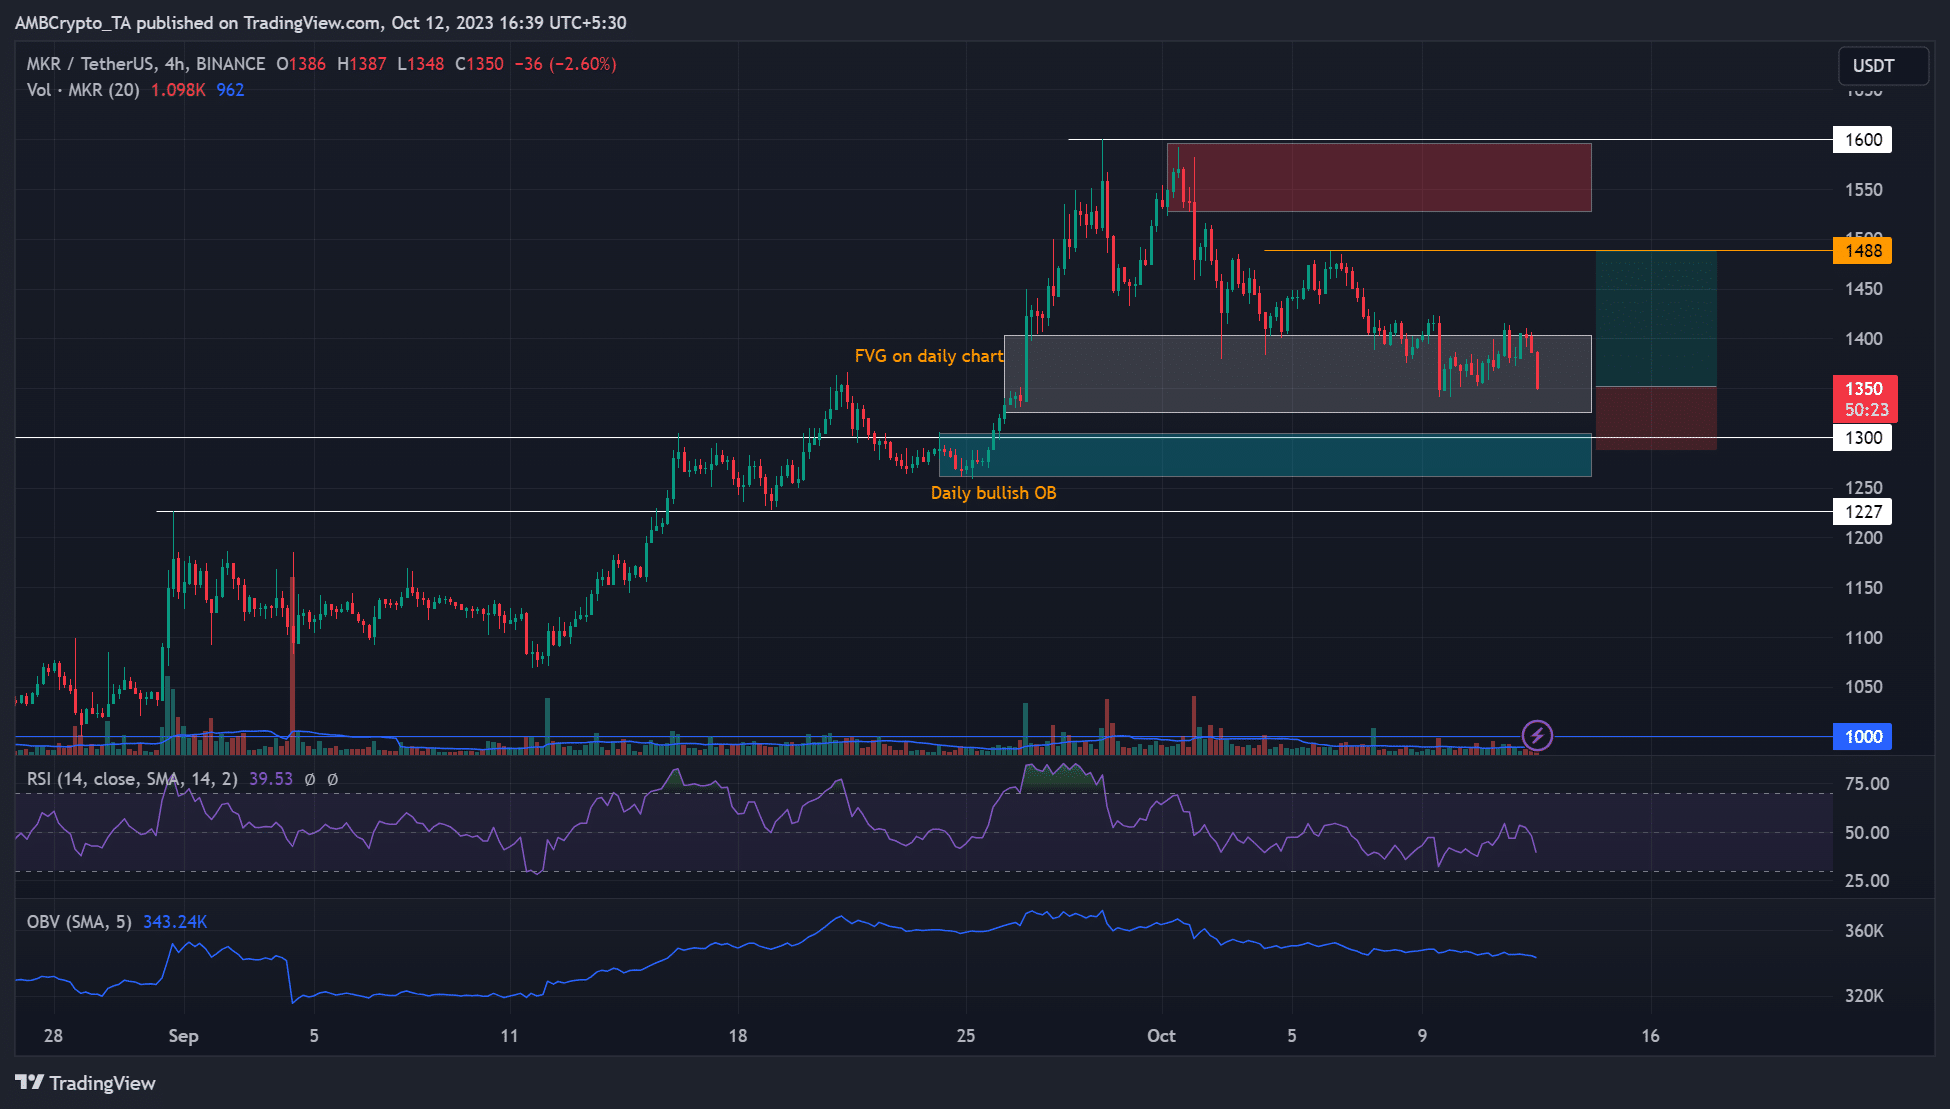
A price imbalance and FVG (Fair Value Gap) existed on the daily chart at $1326 – $1403 (white). The aforementioned area prevented MKR’s extra price plunge since 2 October. A daily bullish order block (OB) of $1261 – $1306 (cyan) existed below the price imbalance.
So, the two aforemarked areas could resist extra price drops. If so, a possible recovery from the area could present a long position, with a potential 10% gain if the rally hits the recent lower high level of $1488.
However, a drop below the daily bullish OB of $1261 will invalidate the aforementioned bullish bias.
Meanwhile, the RSI faced rejection at the mid-level of the 50-mark and projected a downtick. The movement underscored a spike in selling pressure in the past few days.
However, spot market demand for MKR has declined since August, as illustrated by the retreating OBV over the same period.
Long-term price trend flipped negative
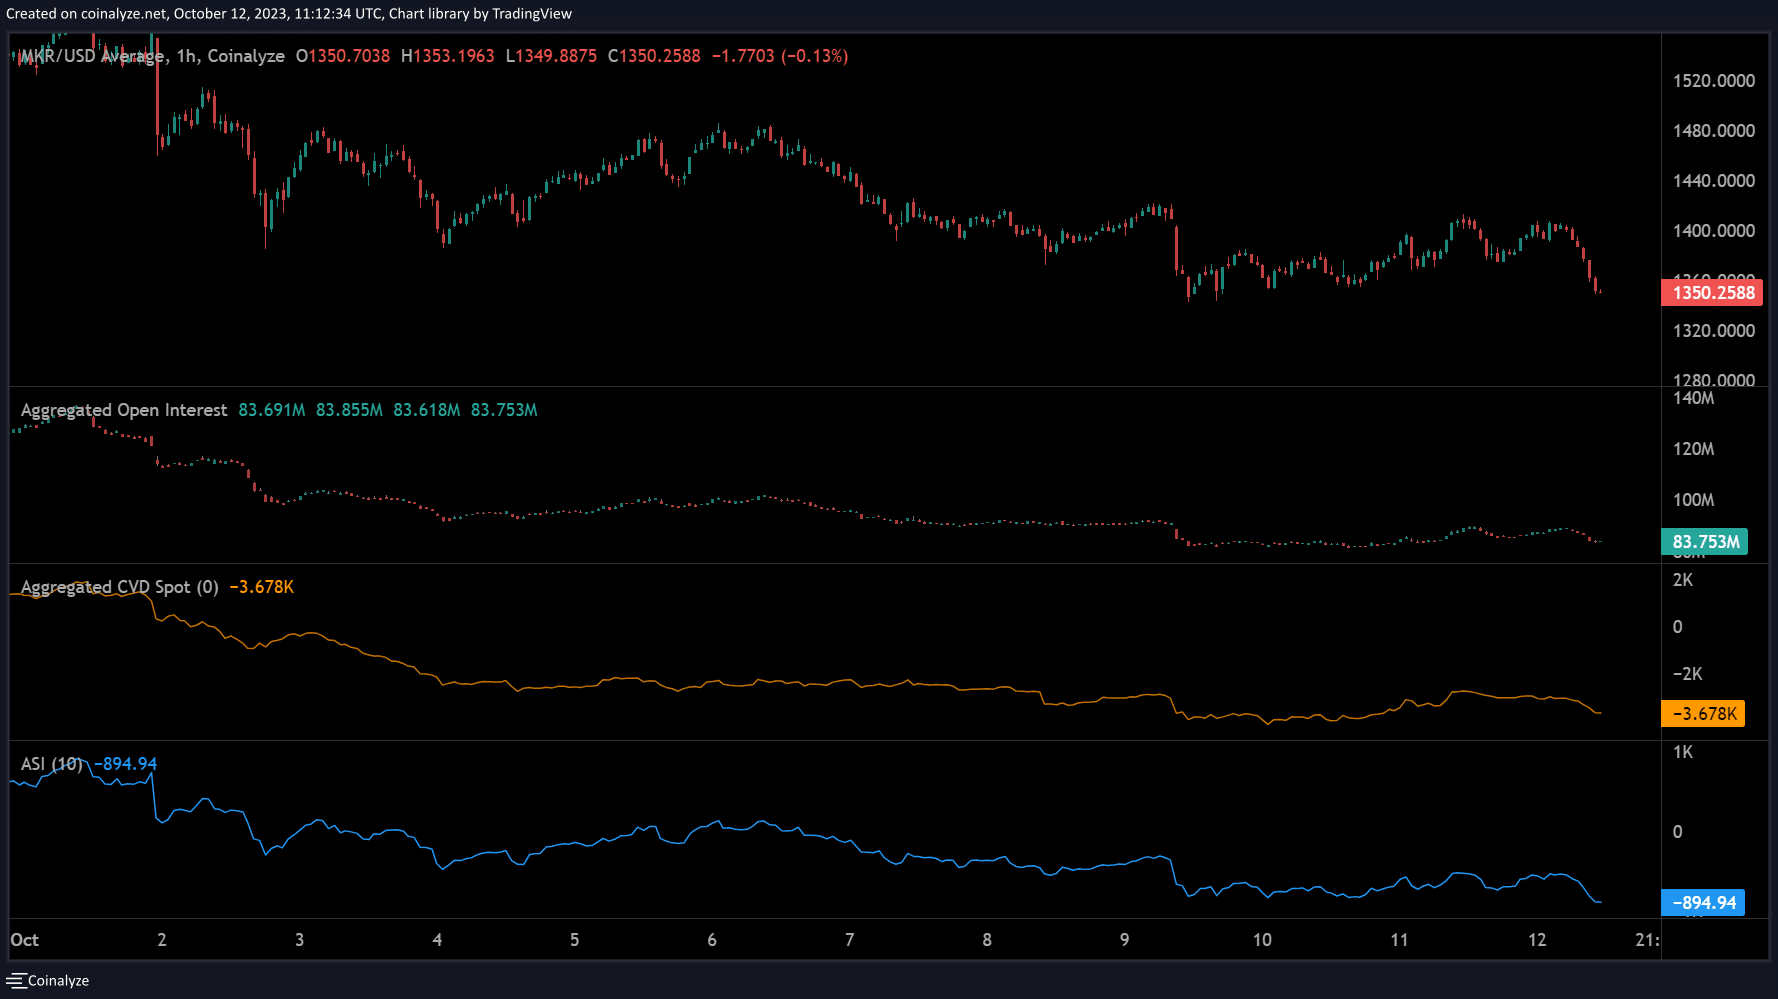
The Futures market data at hand wasn’t inclined towards the said bullish idea. In particular, the Accumulative Swing Index (ASI) turned negative, indicative of a negative long-term price trend. Put differently, MKR was on a downtrend, making the said bullish idea a risky proposal.
How much are 1,10,100 MKRs worth today?
Besides, the increased sellers’ market edge further confirmed the bearish grip, as highlighted by the negative CVD (Cumulative Volume Delta). Additionally, the Open Interest rates fluctuated and could favor sellers more.
It meant that the said long idea would be a risky setup. So, tracking BTC’s price action will be vital for risk mitigation.


