Mantle loses key long-term support as selling volume surges 44%
The latest MNT downward continuation signal came when the $0.506 lower low was broken on Wednesday, the 24th of June.

The crypto market has faced a tough week of trading. Since Monday, June 22, Bitcoin [BTC] has fallen 8.6%, from $65.6k to $60k. During this time, Mantle [MNT] prices have slid by 21.6%, from $0.541 to $0.416.
In the past 24 hours alone, MNT prices were down by just under 10%. The daily trading volume has increased by 44%, which indicates heightened selling activity as prices slid lower.
The Mantle price drop was influenced by Bitcoin, which in turn reacted to macro market news. Inflation was on the rise. Data from the Bureau of Economic Analysis showed that the personal consumption expenditures price index (PCE) was up 4.1% year-on-year in May 2026, reaching a 3-year high.
This triggered a sell-off, and long liquidations sent prices reeling lower. Mantle’s long-term price trend was bearish, and the recent losses reinforced this bias.
MNT slips below key long-term support
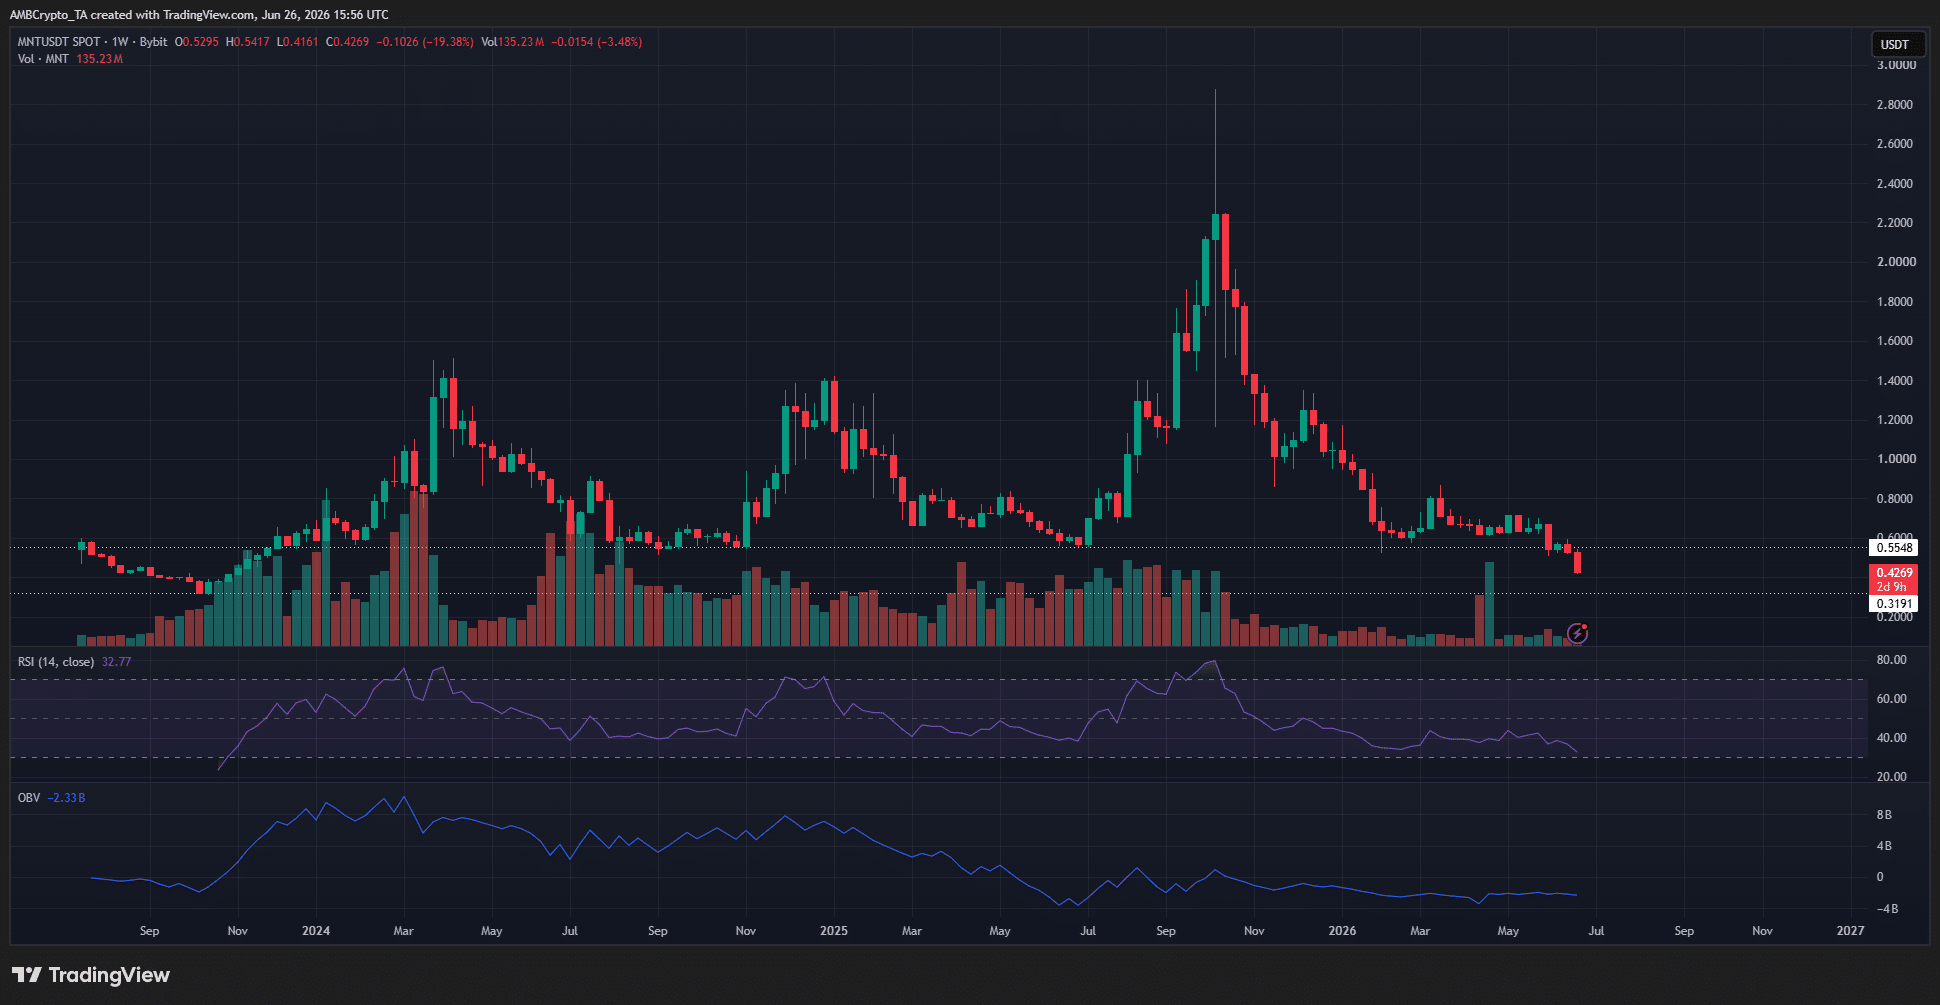
The 1-week chart of MNT highlighted the importance of the $0.55 support level. The buyers have defended it since early 2024. Losing this critical long-term support level meant the long-term trend was now bearish.
The RSI was at 32.7 and not yet at oversold conditions. The OBV has bounced since last July but was slowly sliding lower, too.
This week’s losses meant the altcoin is likely to drop to the $0.319 support level soon, and possibly even lower.
Traders’ call to action- Wait to sell the bounce
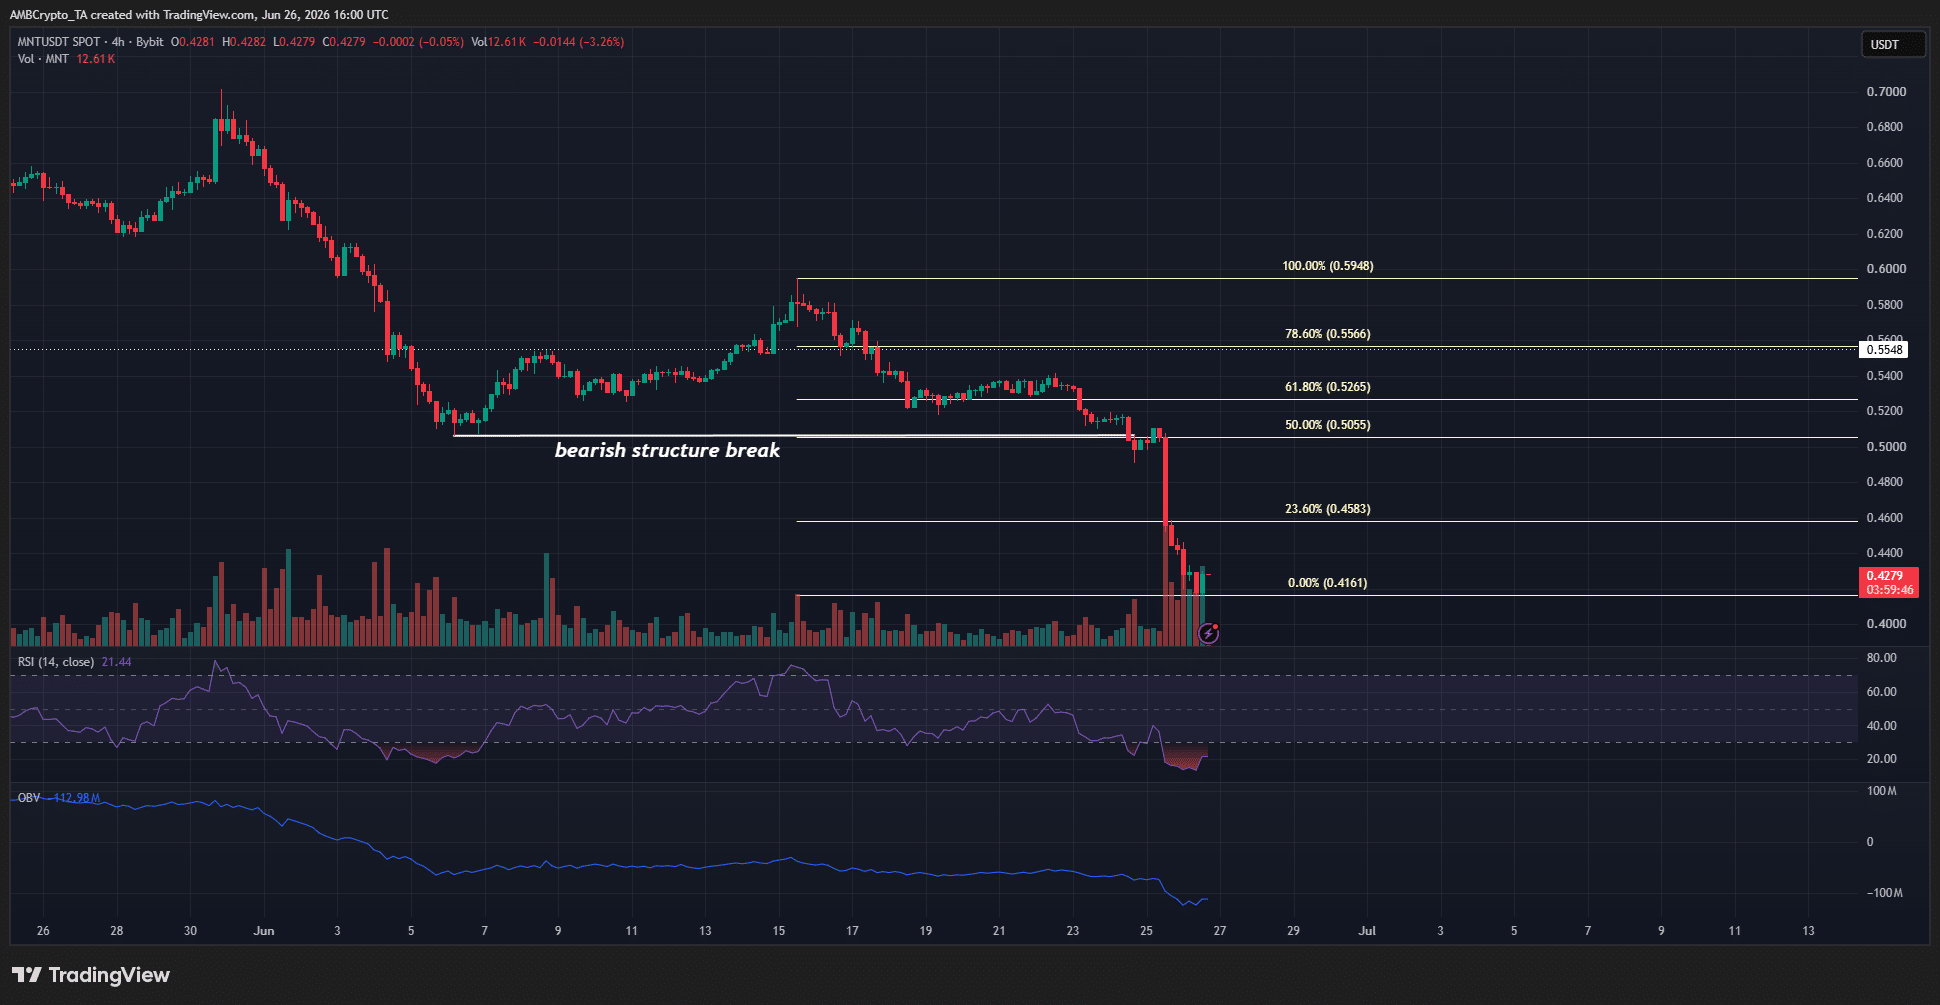
The 4-hour timeframe showed a bearish swing structure. The latest downward continuation signal came when the $0.506 lower low was broken on Wednesday, June 24.
The RSI was deep in oversold conditions, and the OBV’s downward moves were much more apparent than on the weekly timeframe.
This, combined with the break of the weekly support, meant that the current H4 swing move lower was over, or close to being over. A bounce is likely to commence from here, reaching the key Fibonacci retracement targets overhead.
Therefore, a bounce into the golden pocket at $0.526-$0.556 would offer a selling opportunity.
Final Summary
- The Bitcoin price drop earlier this week spurred the heavy MNT losses as market participants sought not to endure the rocky seas.
- Traders can wait for a price bounce toward $0.55 before selling.


