Mapping Cardano’s path after $0.25 rejection – What ADA traders should watch
Cardano saw a sharp move higher up to $0.25 but was unable to make the full rally stick.


Cardano [ADA] is down 5% in the past 24 hours, but has rallied 20% over the past week and nearly 30% in a month. Despite the short-term setback, the trend appeared to be favoring the bulls.
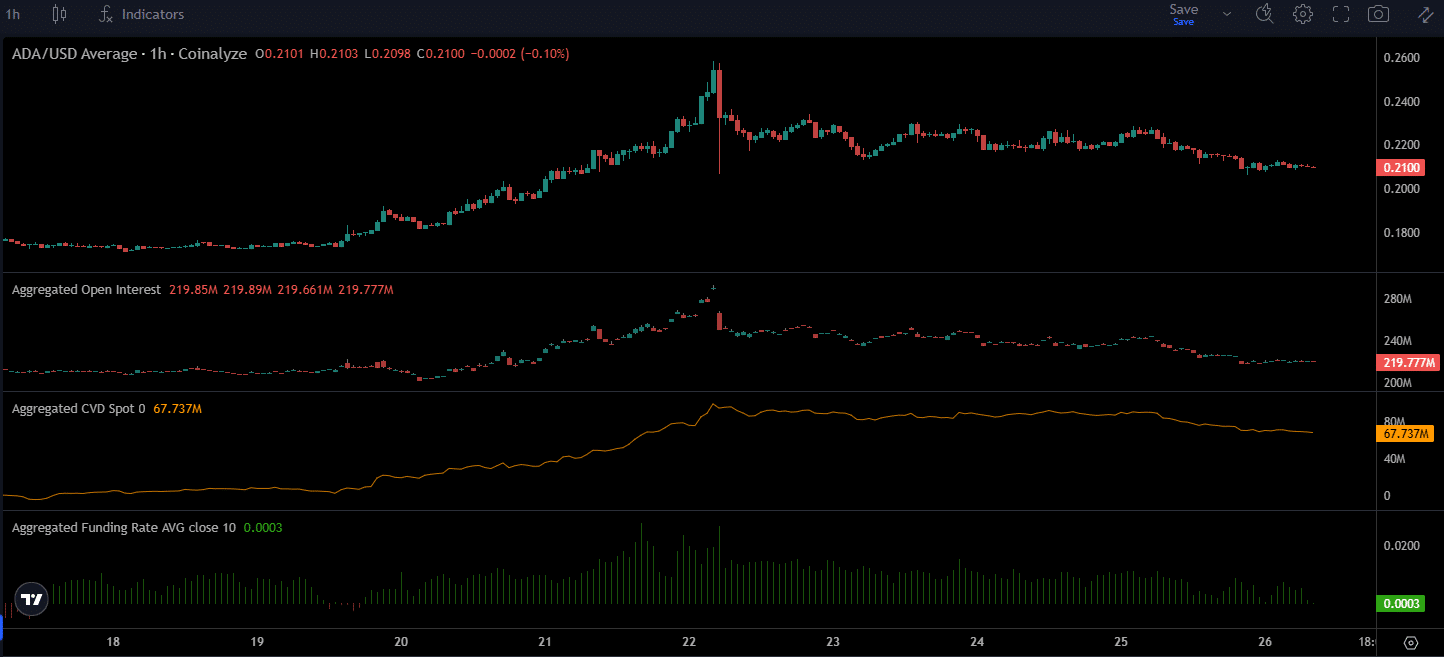
The selling pressure in recent hours was not extreme. The Open Interest slumped by 6.5%, and the spot CVD saw a slight slump. Together, the indicators presented the case of a minor reset in market sentiment and willingness to remain bullish.
The price structure and magnetic zones helped reveal what could be in store next for Cardano.
The importance of the Cardano rejection from $0.25
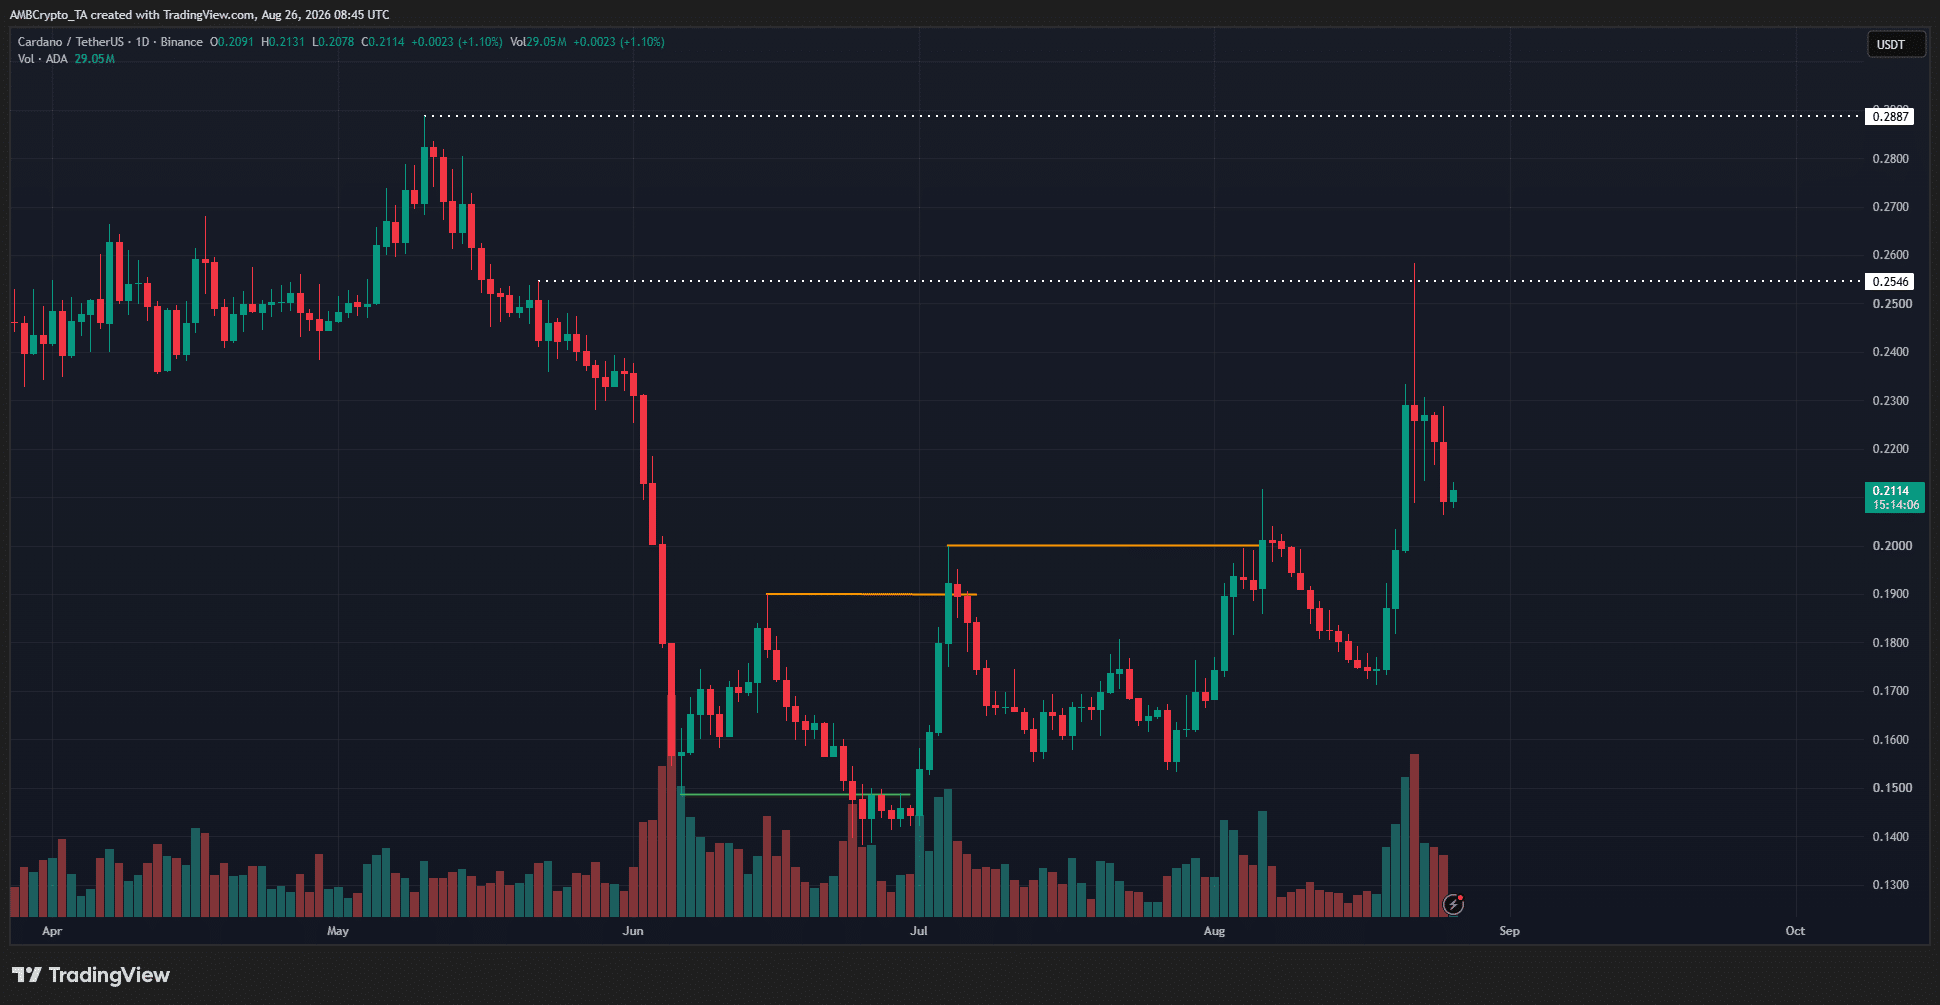
On the 1-day timeframe, the market structure was bullish.
Since June, the swing highs have been breached, and higher lows have been formed since then. The latest higher low, at $0.177, is the level the bulls must defend in order to keep the upward structure intact.
The $0.25 resistance zone marked a local high made during the sell-off in May. It also represented the supply zone that Cardano was stuck at in April.
A price move into this supply zone and an 18.6% correction within five days indicated a short-term parabolic move and heavy profit-taking. The bullish swing structure remains, but short-term sentiment might be muted.
The case for an extended retracement phase
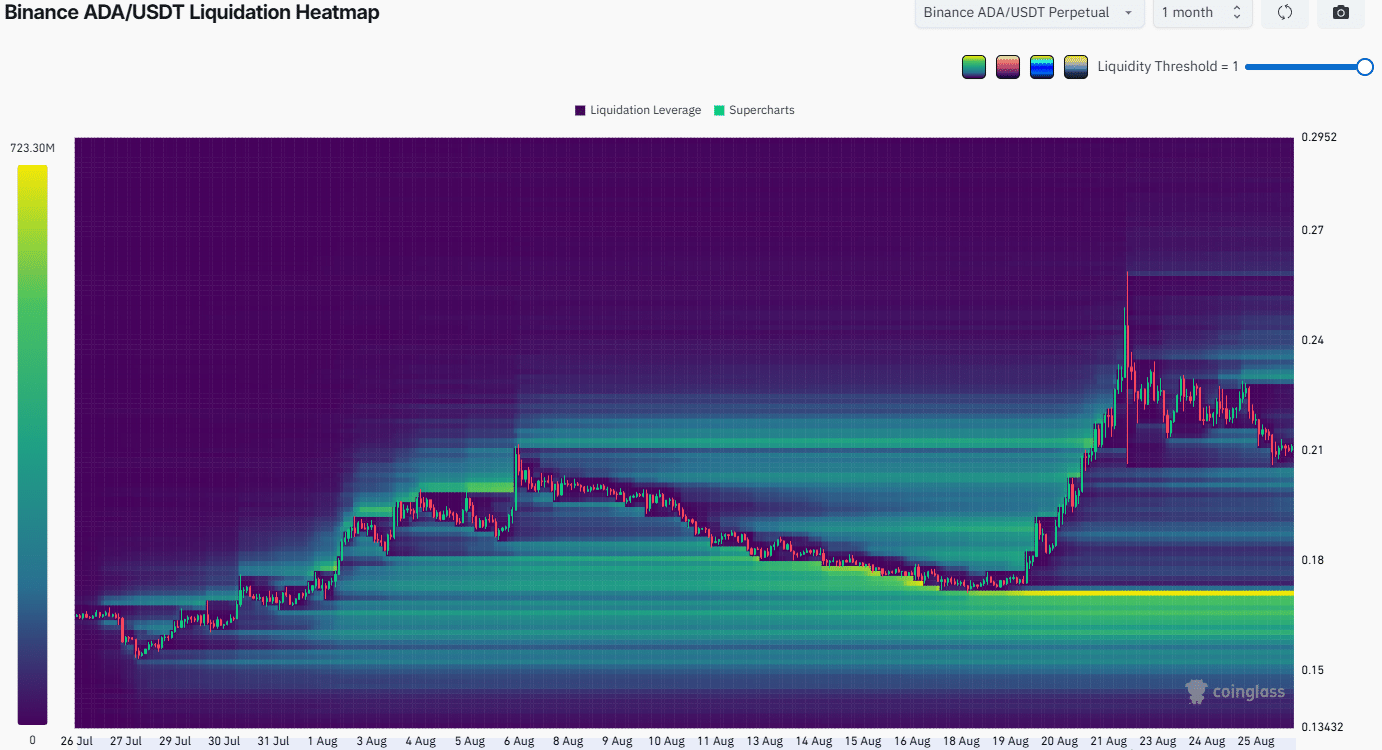
In August, several short liquidations had built up from $0.18 all the way up to $0.22. Within a few days, these short liquidations were wiped out as Cardano prices rallied hard to reach the $0.25 area.
Generally, a strong move higher on big volume and a quick throwback signal a short squeeze. Profit-taking in the $0.23-$0.25 supply zone also amplified the volatility.
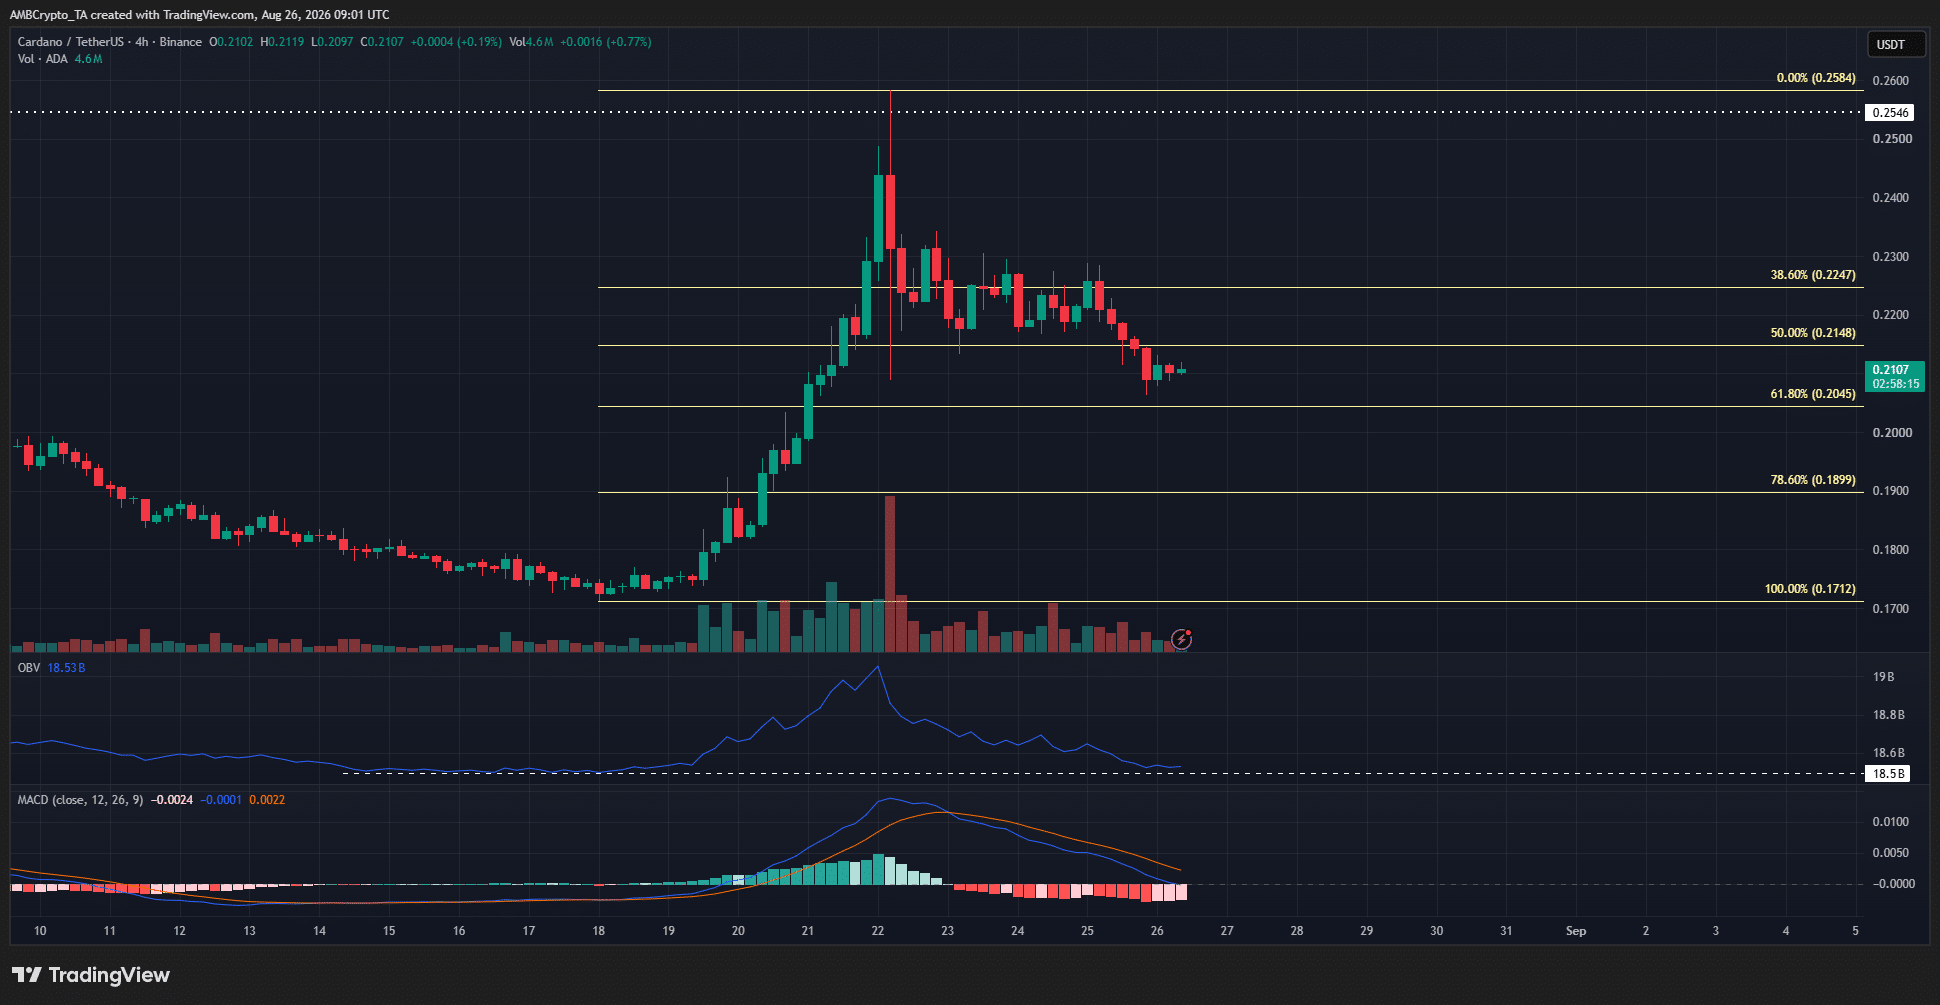
The OBV was nearing the mid-August lows again, signaling heavy sell pressure during the latest rejection. Momentum on the 4-hour timeframe was also turning bearish and could lead to a deep retracement toward $0.19.
The bulls will want to see buying pressure ramp up as ADA approaches the $0.19-$0.20 demand zone.
Flat trading volumes and muted aggressive buying would mean there’s a chance of choppy, sideways price action for a few days around $0.20 as bulls and bears fight for control of the market.
Final Summary
- Cardano saw a sharp move higher up to $0.25 but was unable to make the full rally stick.
- A short-term retracement phase could send prices below $0.20 in the coming days.