Mapping how Worldcoin [WLD] can rally to $3.2 on the price charts
![Mapping how Worldcoin [WLD] can rally to $3.2 on the price charts](https://ambcrypto.com/wp-content/uploads/2024/10/Abdul-WLD-1200x686.webp)
- For WLD’s rally to be fully confirmed, it needs to breach a significant resistance level at $2.182
- Technical indicators and on-chain metrics indicated that this level might be breached soon
Over the last 24 hours, Worldcoin [WLD] has hiked by 10.81% on the charts, hitting a trading price of $2.041 at press time. However, the continuation of WLD’s rally may be threatened by a resistance level slightly above its press time price. This could potentially cap further gains on the charts.
WLD rally encounters a potential setback
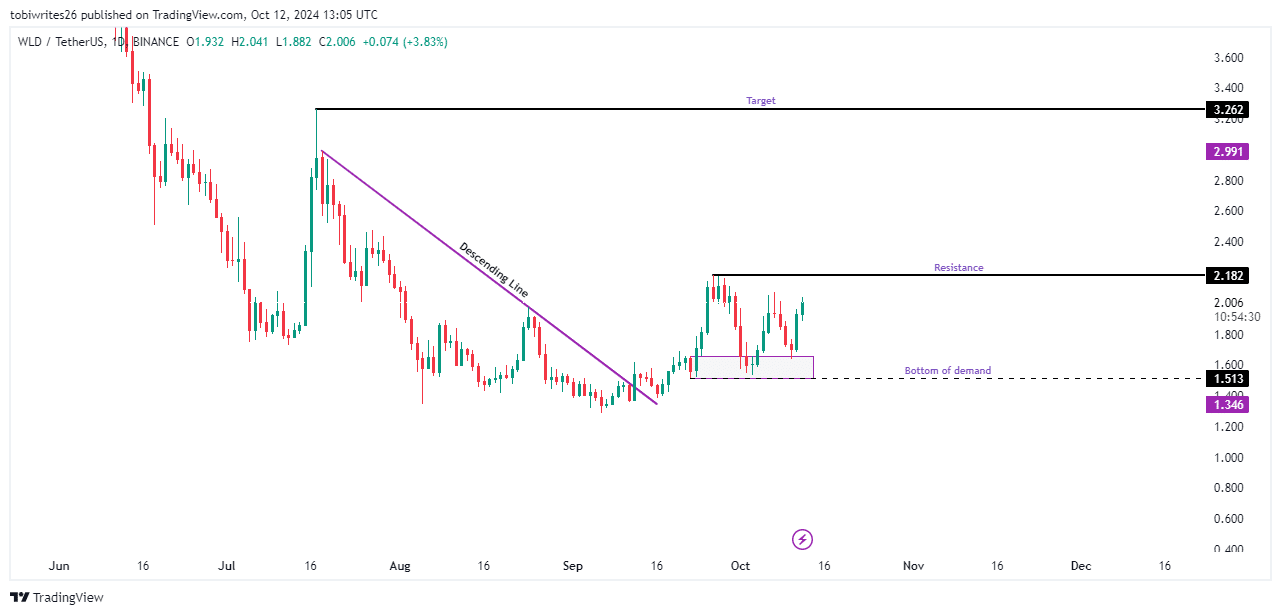
WLD seemed to be on track for $3.2 after breaking out of its descending trading pattern, while also forming a higher high. However, it has since struggled to establish a new higher high to solidify its upward trajectory on the charts.
At press time, WLD had entered a major demand zone and appeared to be forming a higher high. However, it must first overcome resistance at precisely $2.182 – Its previous breakout high.
If WLD can breach this resistance, long traders would likely dominate the market dynamics. This can push the price to the peak of the descending line, before a potential re-evaluation of price levels.
Conversely, if WLD falls back into the demand zone and breaches the lower boundary at $1.513, the asset’s price could register a significant decline.
Despite these challenges, however, AMBCrypto found that the market sentiment remains bullish – Supporting the potential for upward movement.
Strong liquidity inflows and bullish momentum can propel WLD
Right now, the market sentiment for WLD is strongly bullish – Supported by significant liquidity inflows and positive momentum indicators.
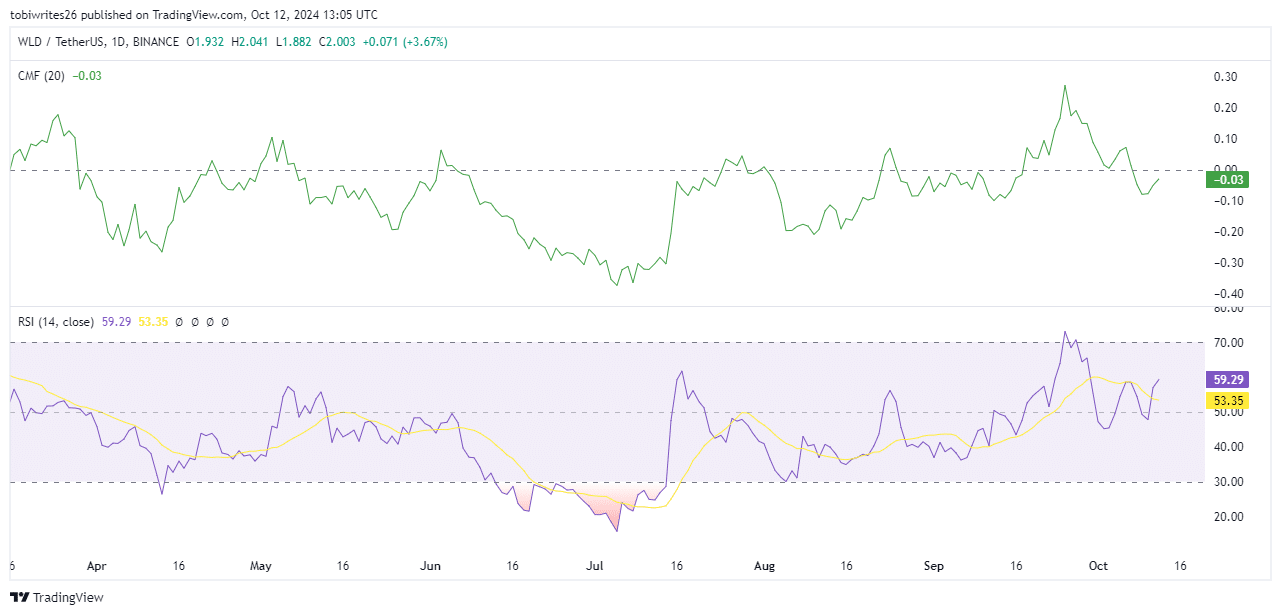
Consider this – The Chaikin Money Flow (CMF), which tracks the volume of money flowing in and out of an asset to assess trader activity, underlined a pronounced buying interest in WLD.
This buying trend was validated by the CMF’s upward trajectory, with the same approaching the critical 0.0 threshold. Crossing this line would be a sign of intensified buying activity.
Additionally, the Relative Strength Index (RSI), which measures the speed and change of price movements, projected an upward trend.
This can be interpreted to be a sign of strong buying pressure and plays into projections about WLD’s price rising. Especially since it would be accompanied by a hike in demand.
Selling activity subsides as short traders face market losses
Over the last 24 hours, the market has seen a notable amount of liquidations, with traders who bet on a decline in WLD noting significant losses as the market moved against them.
At the time of writing, there were $1.99 million worth of WLD liquidations – $1.62 million were from short positions, indicating a strong bullish sentiment in the market.
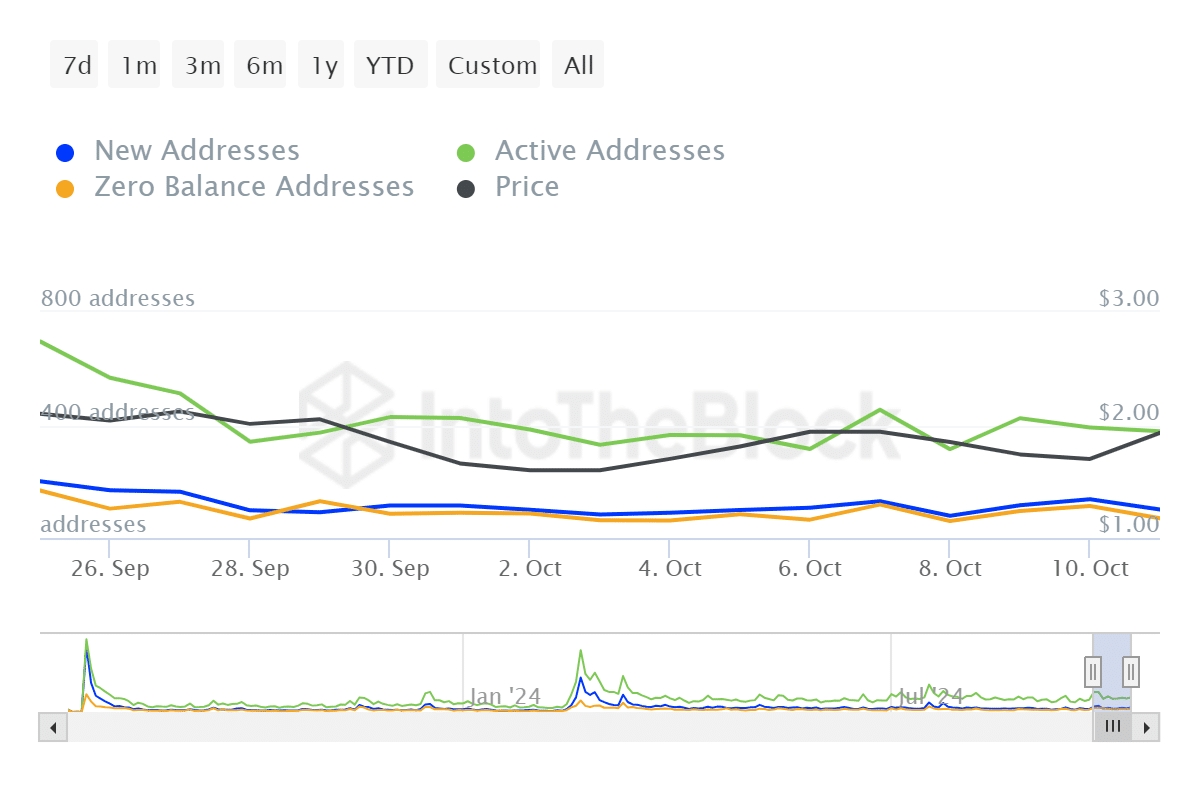
Finally, data from IntoTheBlock revealed a decline in the number of active WLD addresses, reflecting the recent short liquidations that ousted many traders betting against the market.
If these trends persist, it is increasingly likely that WLD will overcome its press time resistances and ascend to higher price levels.


