Mapping out how Cardano’s next attempt to breach $3 might go

Disclaimer: The findings of the following analysis are the sole opinions of the writer and should not be taken as investment advice
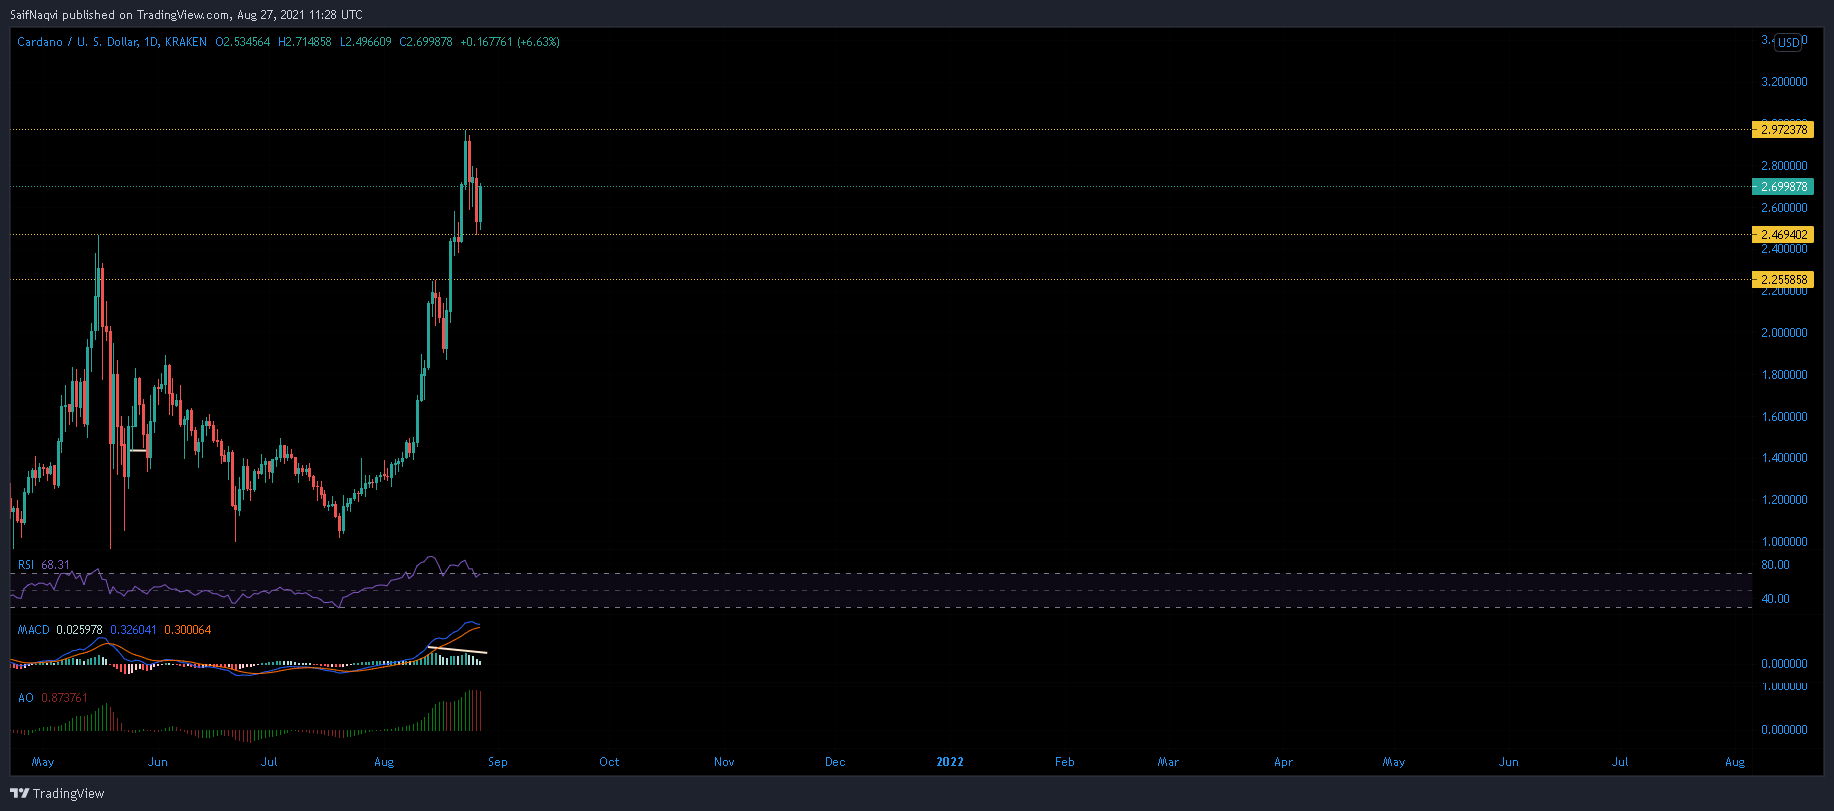
Cardano has seen a healthy correction after a near 200% surge from its July lows. On the dip, ADA’s May ATH of $2.64 marked an ideal entry point for bullish traders and the charts recorded northbound momentum once again. On the downside, it was doubtful whether ADA would be able to sustain another bull run without a stronger correction.
The RSI was close to the overbought zone and the MACD closed in on a bearish crossover.
At the time of writing, ADA was trading at $2.68, up by 4.3% over the last 24 hours.
Cardano Daily Chart

Source: ADA/USD, TradingView
An argument can be made that ADA is preparing for another bull flag breakout after the last formation triggered a 30% spike in price. Previously, buyers flooded in around the $1.89 price level and the same was developing at $2.46. In fact, the 4-hour timeframe had already recorded three straight green candles, with ADA about to challenge the 20-SMA.
A successful close above its 4-hour SMA would likely inject more steam into the market, translating to further upside. Levels to watch out for lay at $2.80, a level from where $2.97 would be targeted by buyers.
It’s also important to keep a close eye on the 24-hour volumes. High volumes would allow ADA to trend higher for a longer duration as opposed to an impulsive drawdown.
Reasoning
While early indications were certainly positive, ADA’s indicators presented a few threats. The Relative Strength Index paved the way for another northbound push into overbought territory. However, the index has formed lower highs lately. If this trend is upheld, ADA’s third peak would be at slightly lower levels which would work against an extended rally prediction.
Moreover, the MACD was close to a bearish crossover and did not factor in ADA’s current price movement just yet. It would be interesting to see how the MACD would shape up in the coming days. But, there was no denying that upwards pressure was easing across the market. This was also evident on the Awesome Oscillator which was positioned for a third consecutive red bar.
Conclusion
While ADA did note an increase in value, there were many question marks with respect to its mid-long term trajectory. First of all, ADA would need to pierce through $2.80 to open up possibilities of a new ATH. From there, a pickup in volumes would dictate further price action.
If ADA forms a double top at $2.96, expect another wave of selling pressure to hit the market.


