MATIC, Binance Coin, Tron Price Analysis: 25 December

As the recovery window opened up, Binance coin and Tron marked a decent recovery to reclaim their crucial support levels. On the other hand, MATIC entered into price discovery to poke its ATH on 23 December.
MATIC
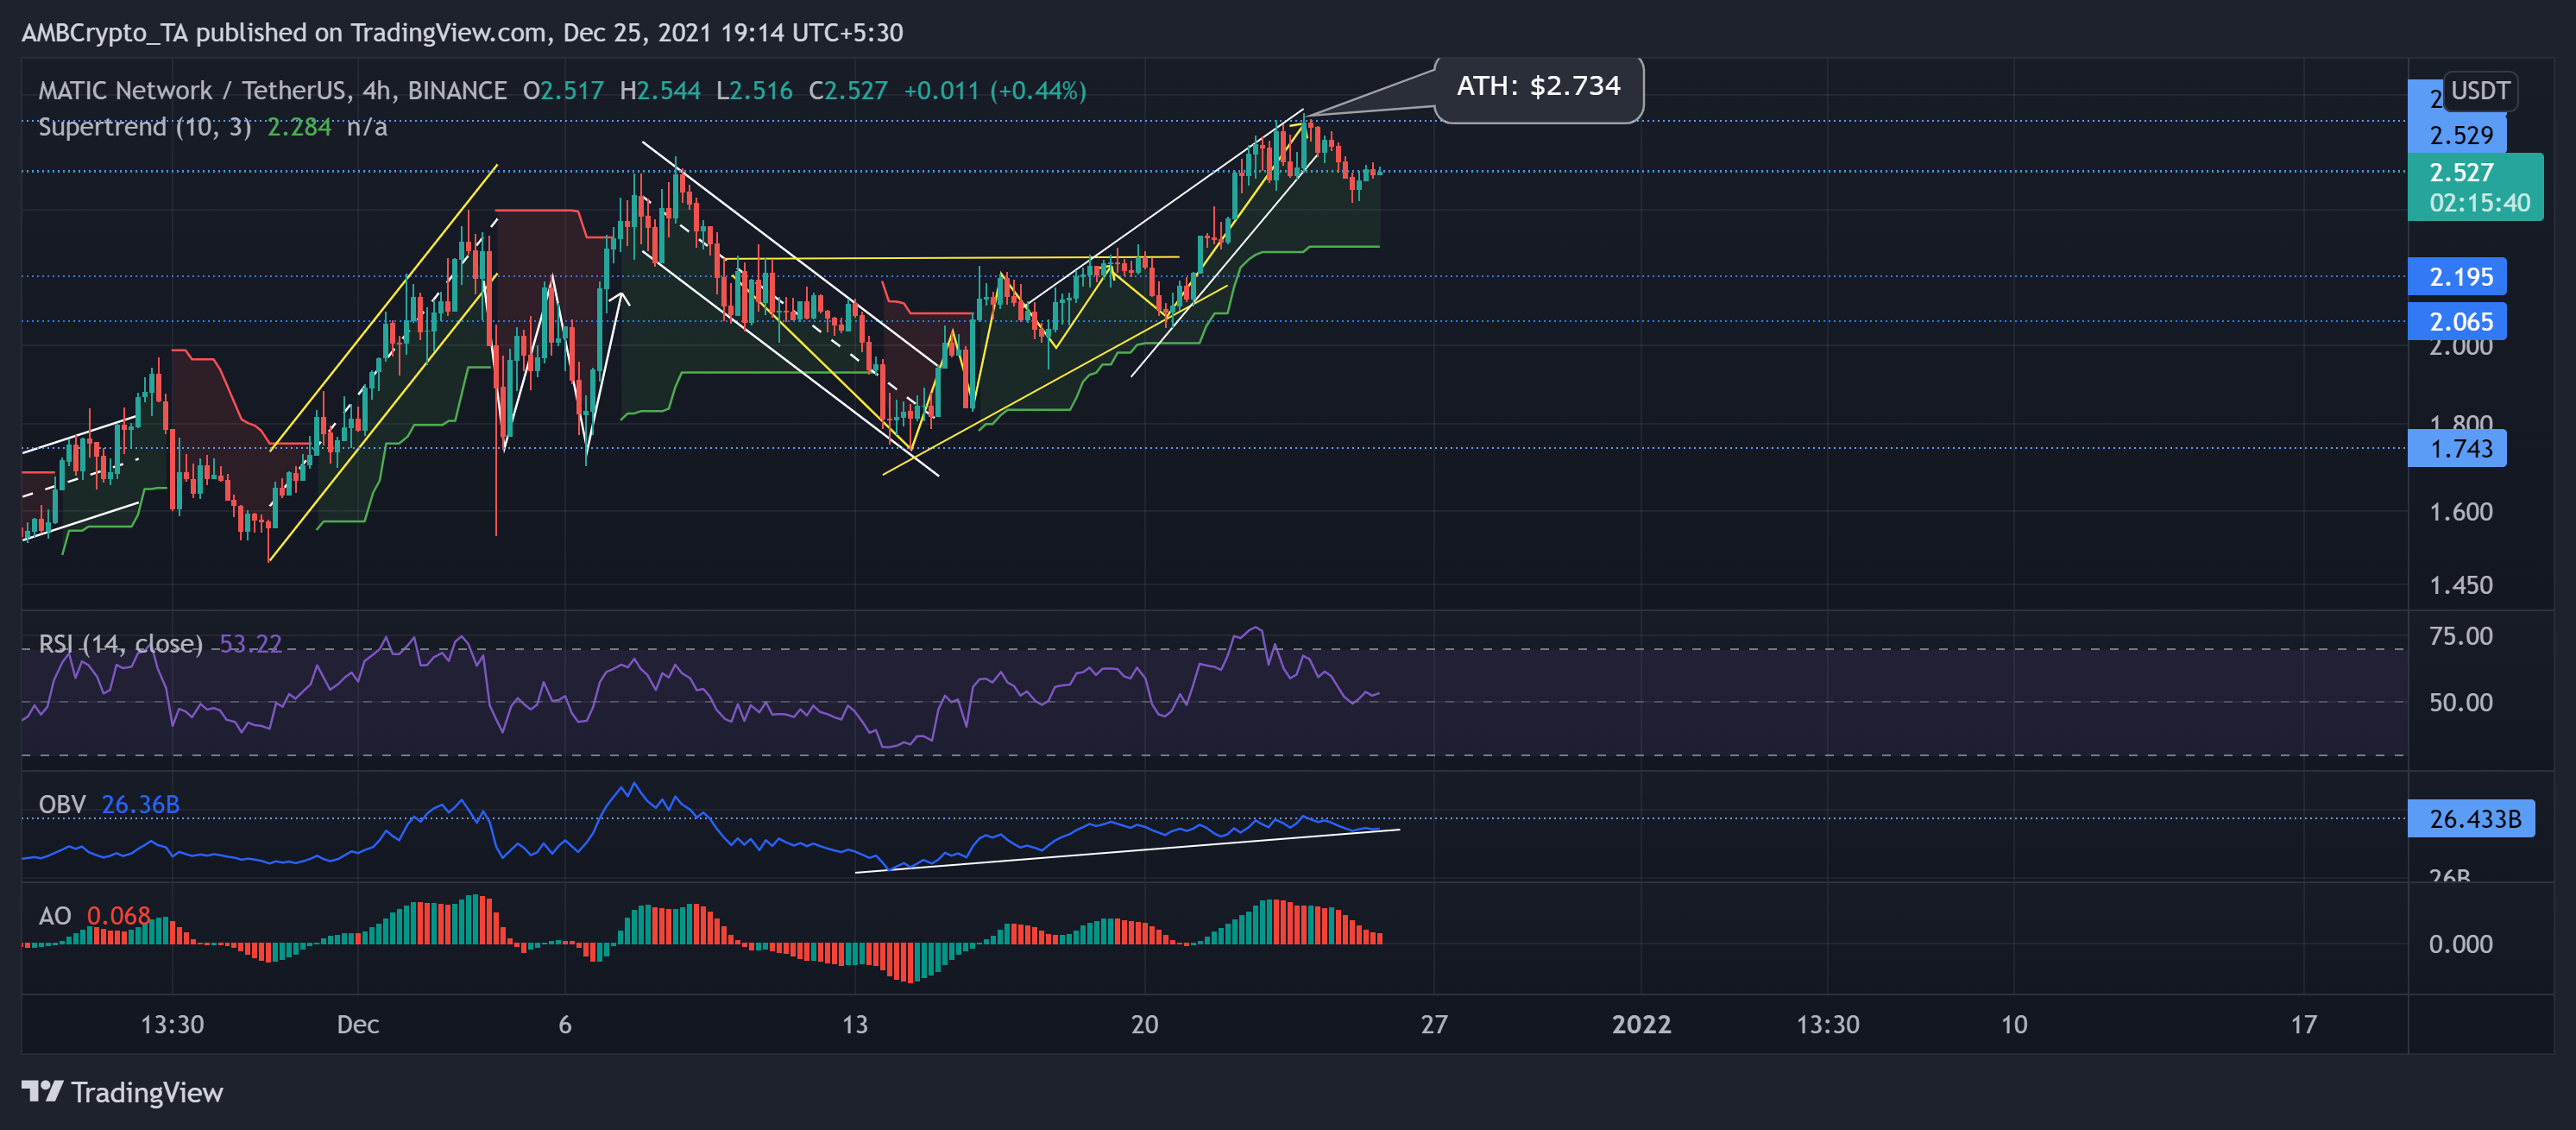
As we saw in the previous article, after continuing its oscillation in an ascending triangle (yellow), MATIC finally broke out of it. After the expected breakout, it encountered the price discovery phase and formed a rising wedge (white) on its 4-hour chart.
MATIC registered over 32% gains (from the 20 December low) and marked a powerful rally to breach crucial resistance (previous) points at the 2.195 and 2.529-mark. Consequently, the altcoin poked its ATH on 23 December while the Supertrend continually flashed buy signals.
Although the price touched its ATH, the OBV could not even match up to its 8 December high. At press time, MATIC traded at $2.527. The RSI saw a steep plunge and seemed to find support near the midline. Further, the AO preferred the buyers but depicted their decreasing power.
Binance Coin (BNB)
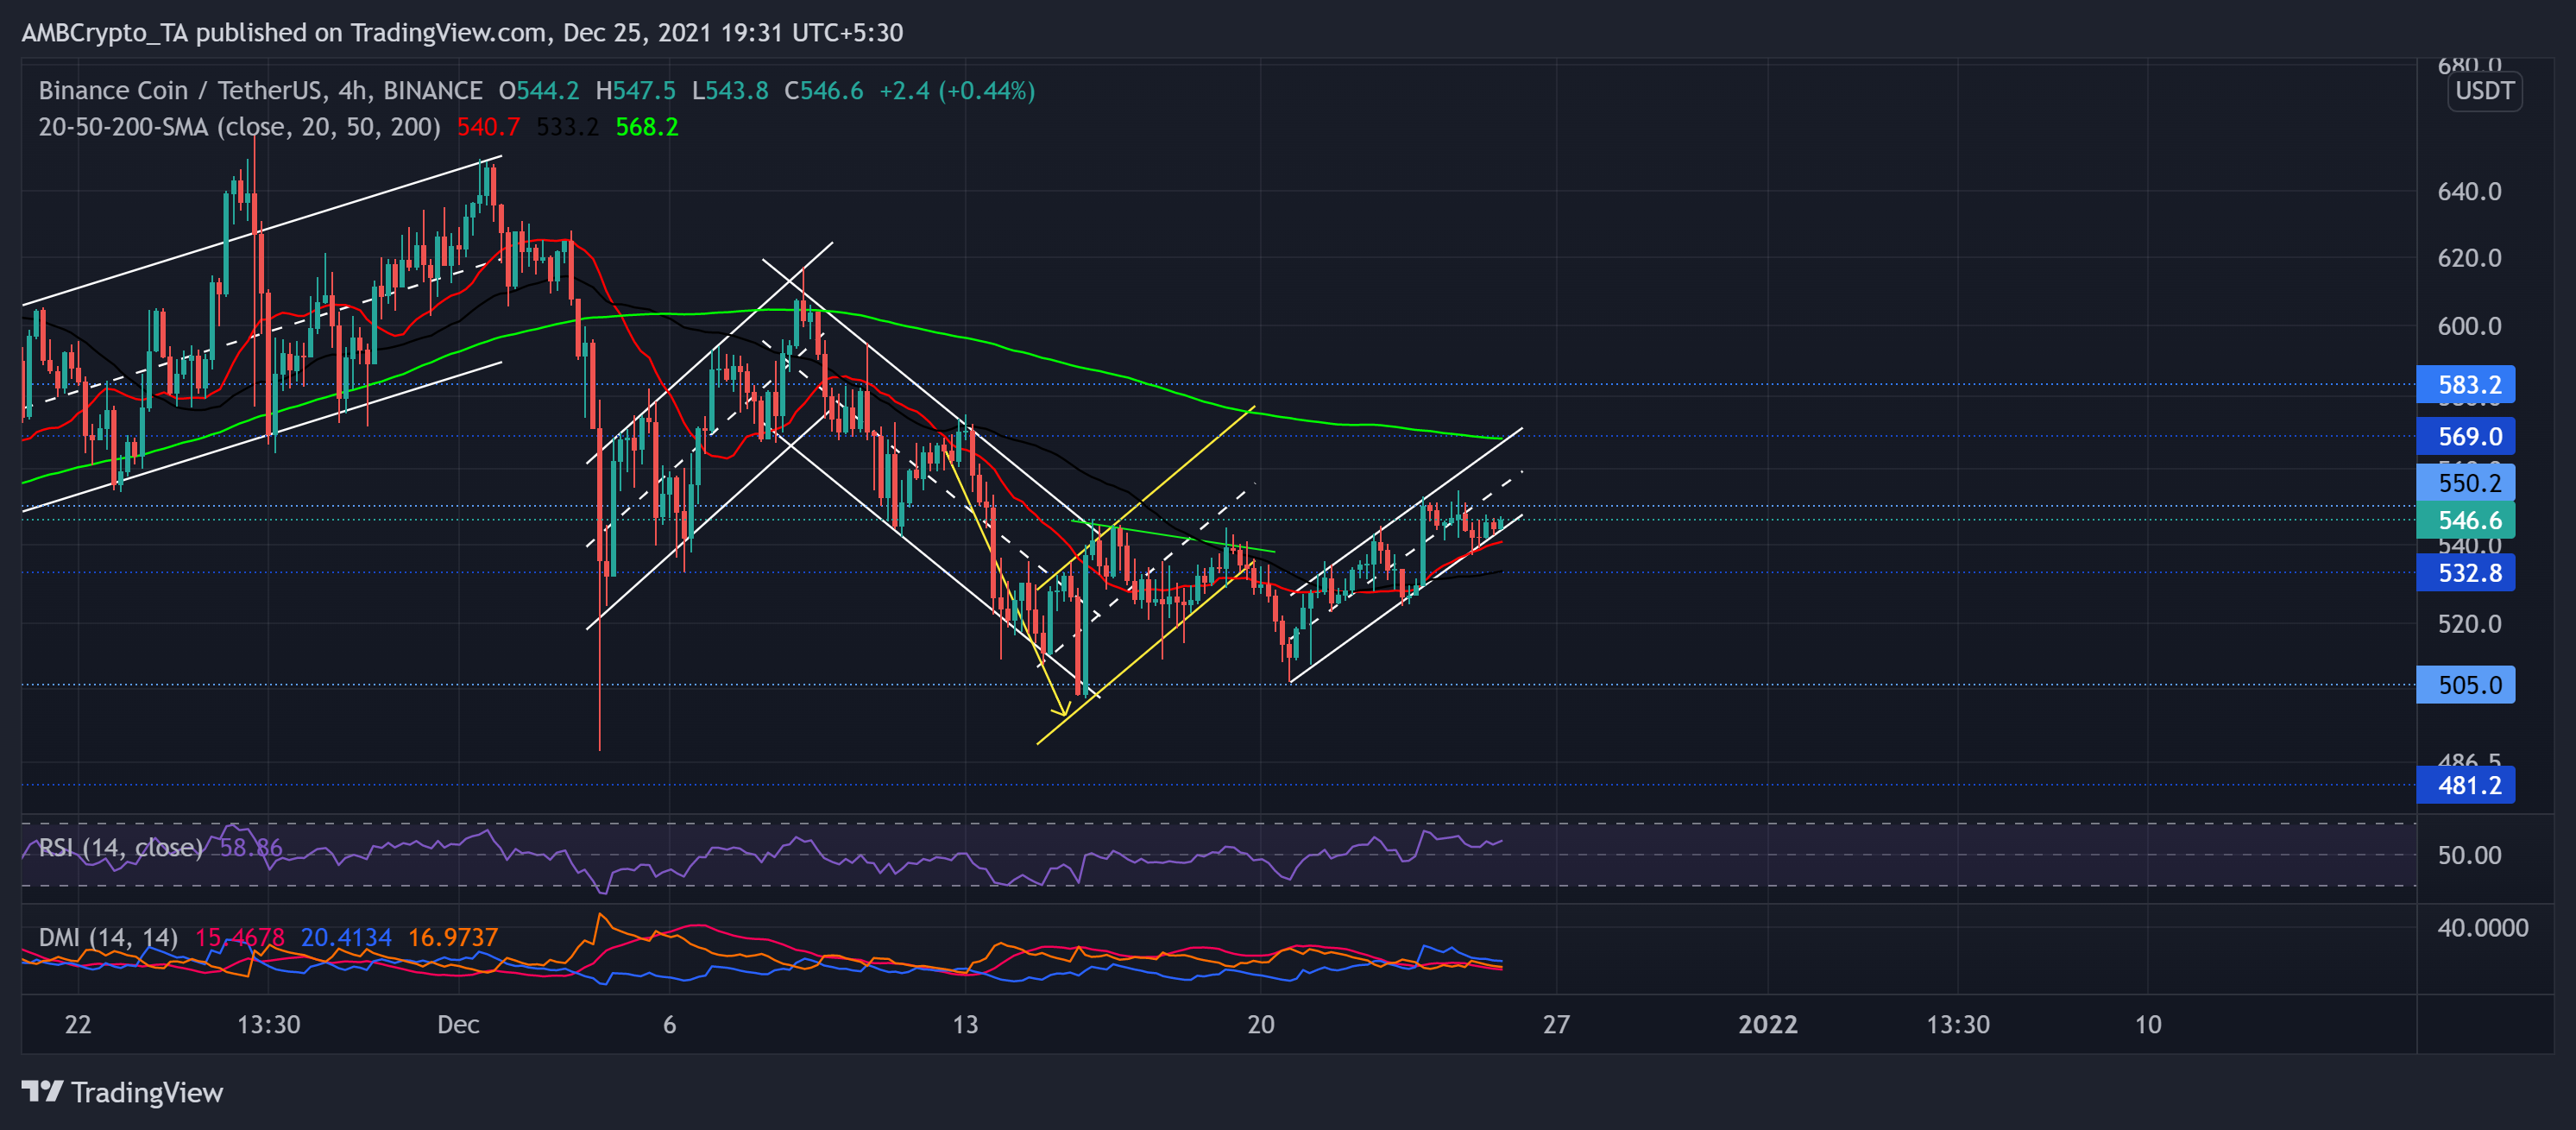
Over the past few days, BNB formed an ascending channel (white) as the bulls breached a strong resistance point (previous) at the $532-level.
Presently, the price action saw resistance at the $550-mark as bulls endeavored to retest it. The immediate testing level stood near the lower channel that concurred with the 20-SMA (red).
At press time, BNB traded at $546.6. The RSI stood at the 58-mark after preferring the bulls. The DMI also resonated with the RSI, but the ADX displayed a weak directional trend for the altcoin.
Tron (TRX)
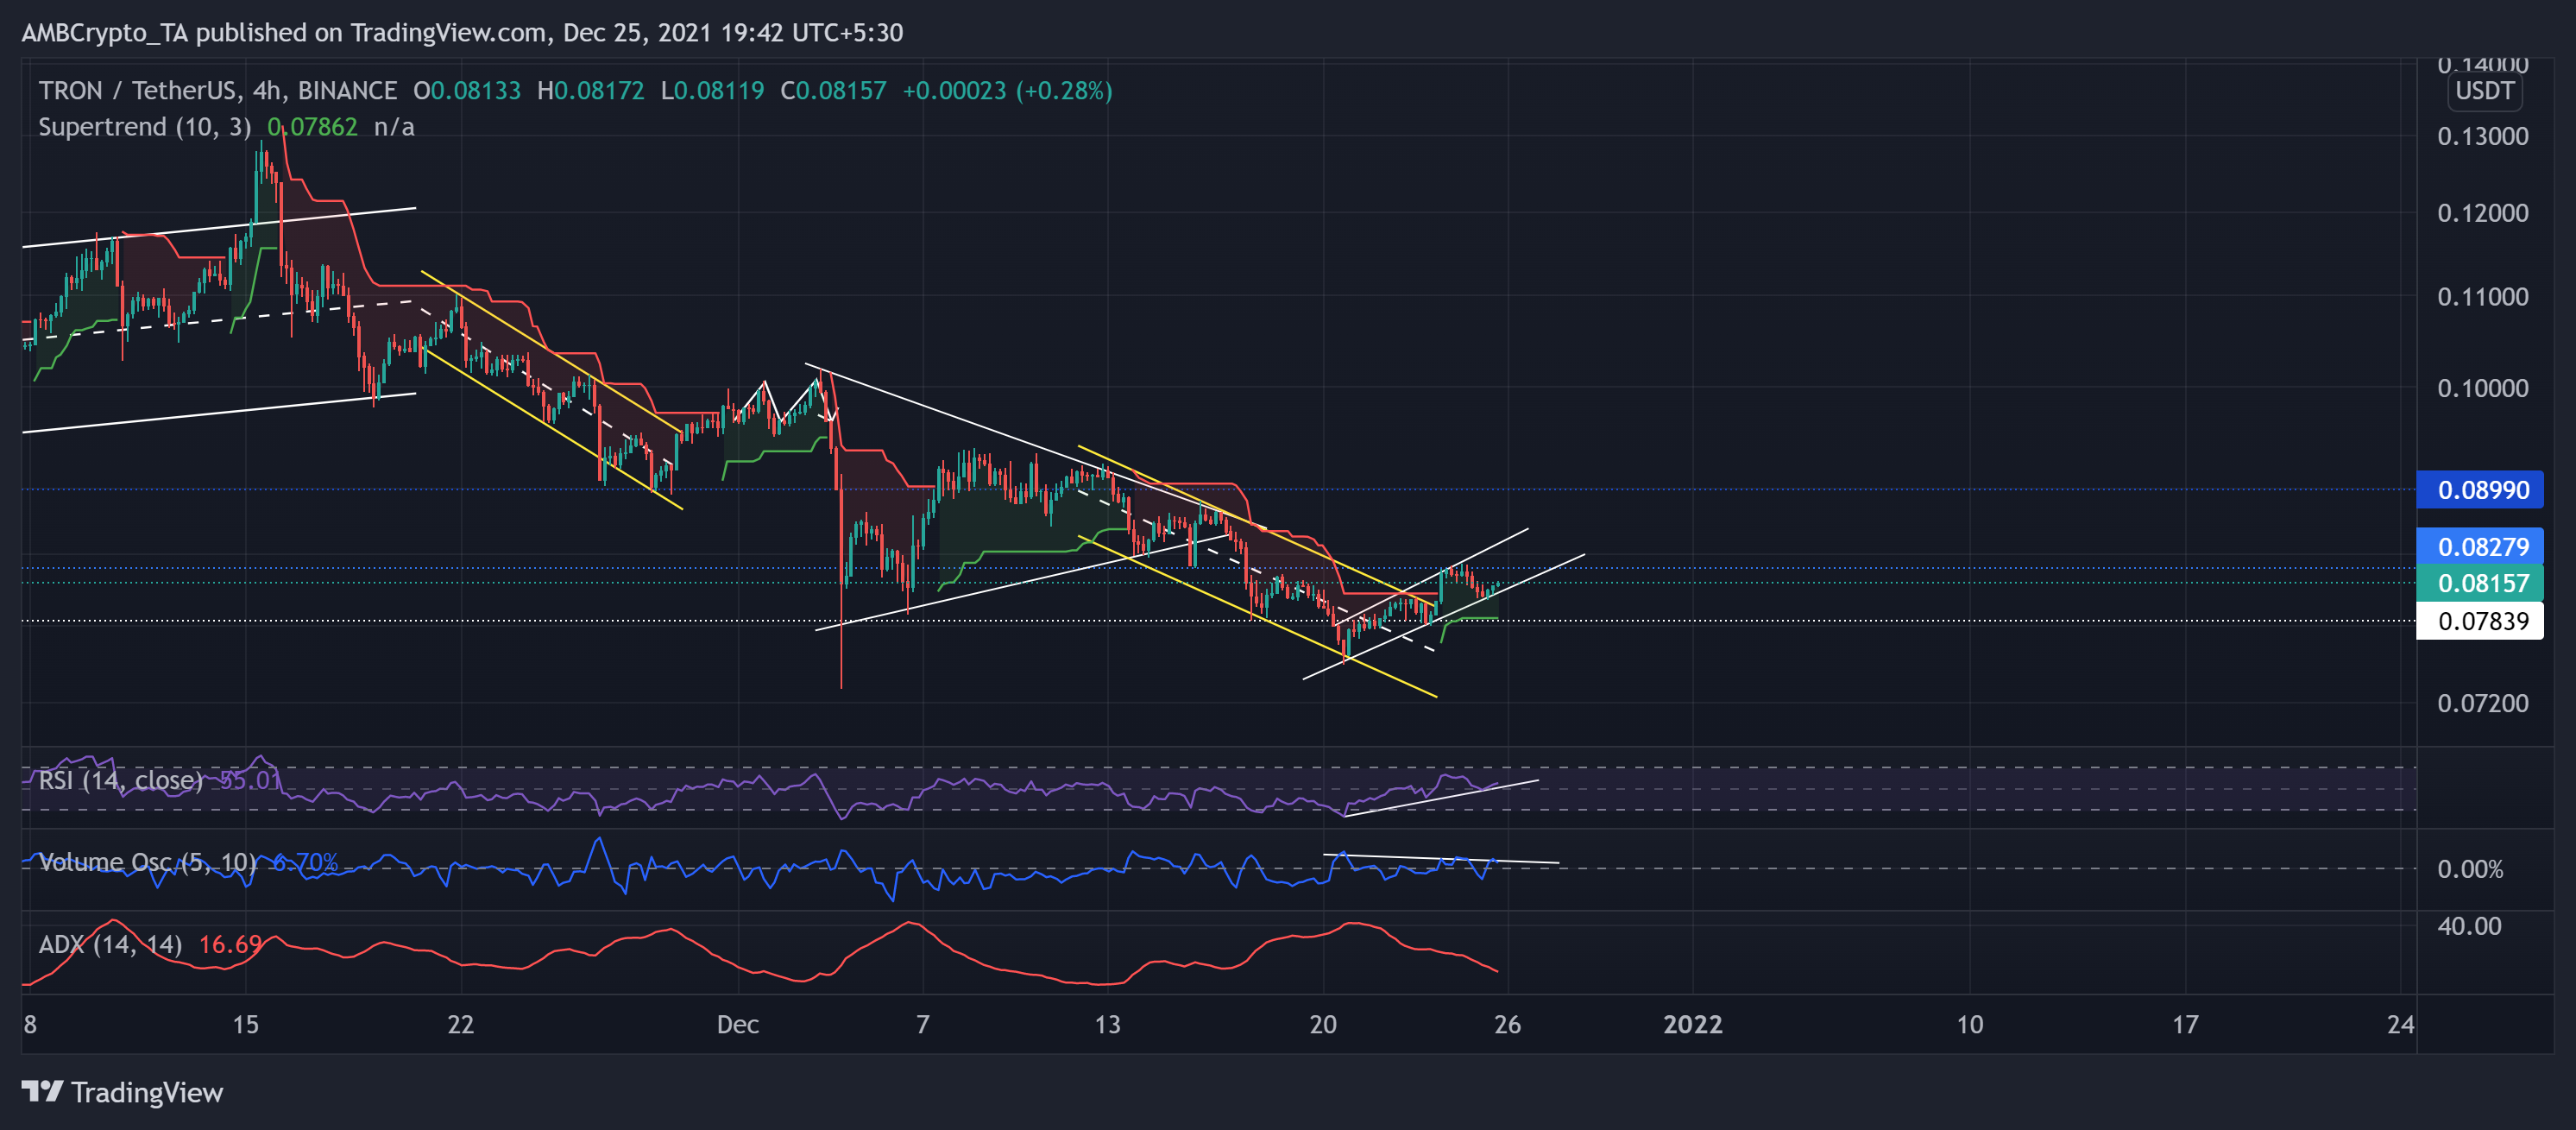
TRX witnessed a symmetrical triangle breakdown on 17 December while the fear sentiment surged. Since then, the alt steadily marked lower lows and lower highs until 23 December after oscillating in a down-channel (yellow).
After losing the crucial $0.078-level (four-month support) the bulls quickly reclaimed this mark after an 8.09% jump (from the 20 December low). As a result, the Supertrend finally flipped into the green zone.
At press time, TRX traded at $0.08157. The RSI was able to sustain itself above the midline after a sharp uptrend. The Volume Oscillator saw lower highs, indicating a weak bullish move. To top that up, the ADX swayed into the weak directional trend zone.