Polkadot, MATIC, The Sandbox Price Analysis: 18 December

While Bitcoin struggled to cross the $47,000-level, the fear sentiment had already heightened. Despite this, MATIC and The Sandbox managed to bag daily gains on their charts as the near-term buying pressure increased.
Polkadot bulls, however, failed to alter the broader trend as it continued to flash weak near-term technical indications.
Polkadot (DOT)
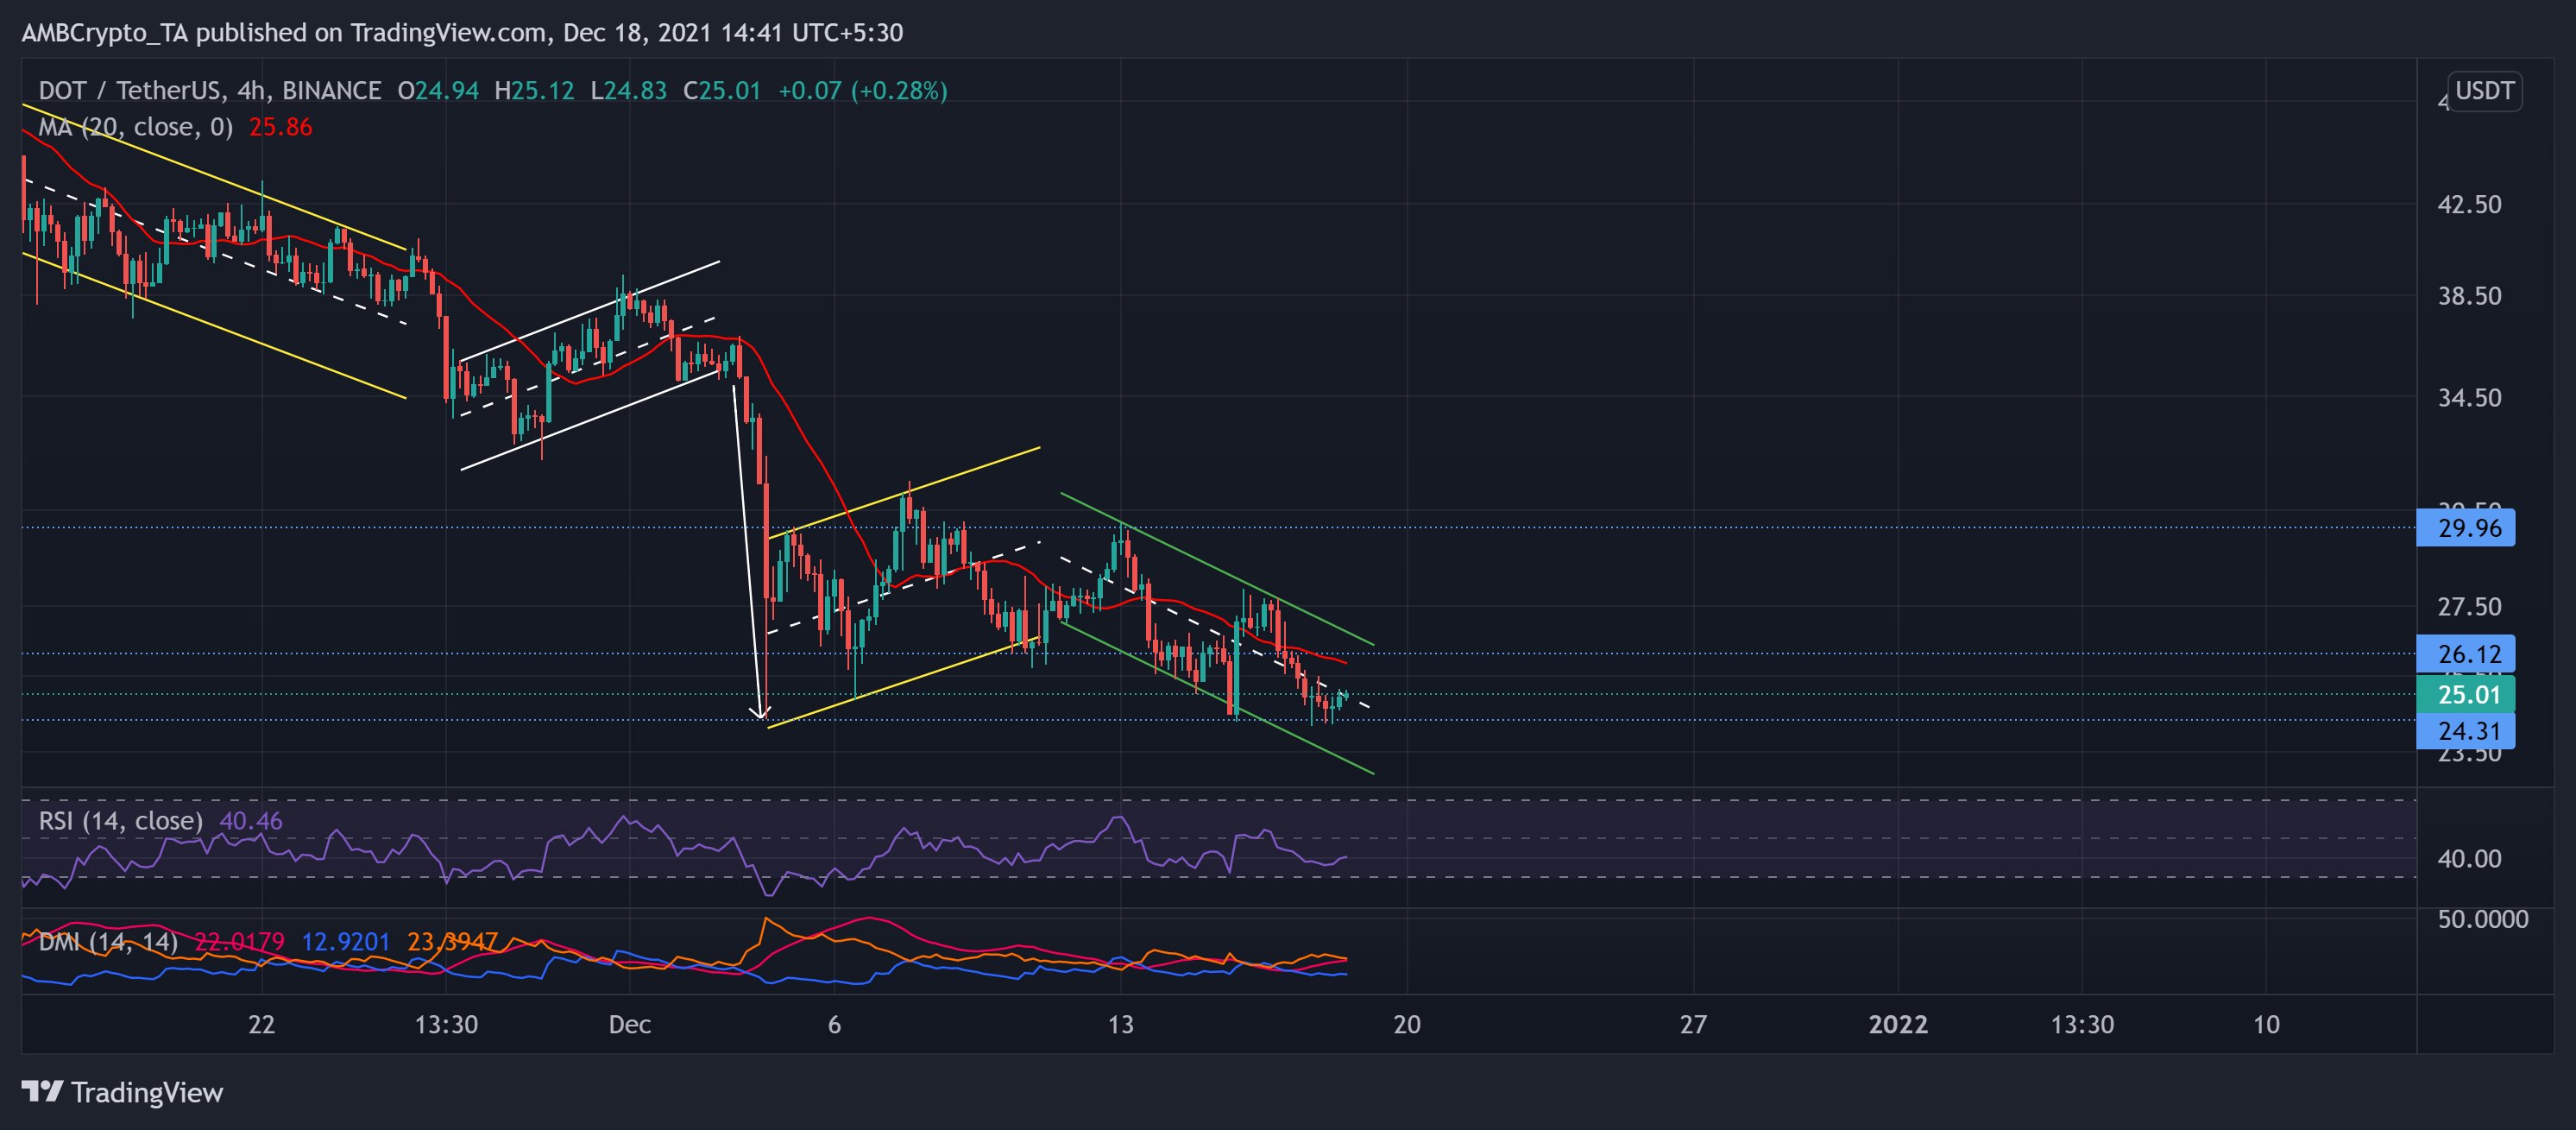
As pointed in the previous article, DOT continued its down-channel trajectory after the anticipated bearish flag breakdown.
This fall occurred after the bulls retested the $29.9-mark thrice since the beginning of the Month. The decline halted at the crucial $24.3 mark that the bulls have ensured for 17 weeks now. As a result, DOT found an oscillating range between the aforementioned levels.
DOT’s bearish streak continued to snowball as it poked its 14-week low on 17 December. Now, the current testing point for the buyers stood near the 20-SMA (red) at the $26-mark.
At press time, the alt traded 54.8% below its ATH at $25.01. The RSI moved sideways near the 40-level, revealing a powerful bearish impact. Further, the DMI reaffirmed the bearish vigor. However, the ADX displayed a weak directional trend for the token.
MATIC
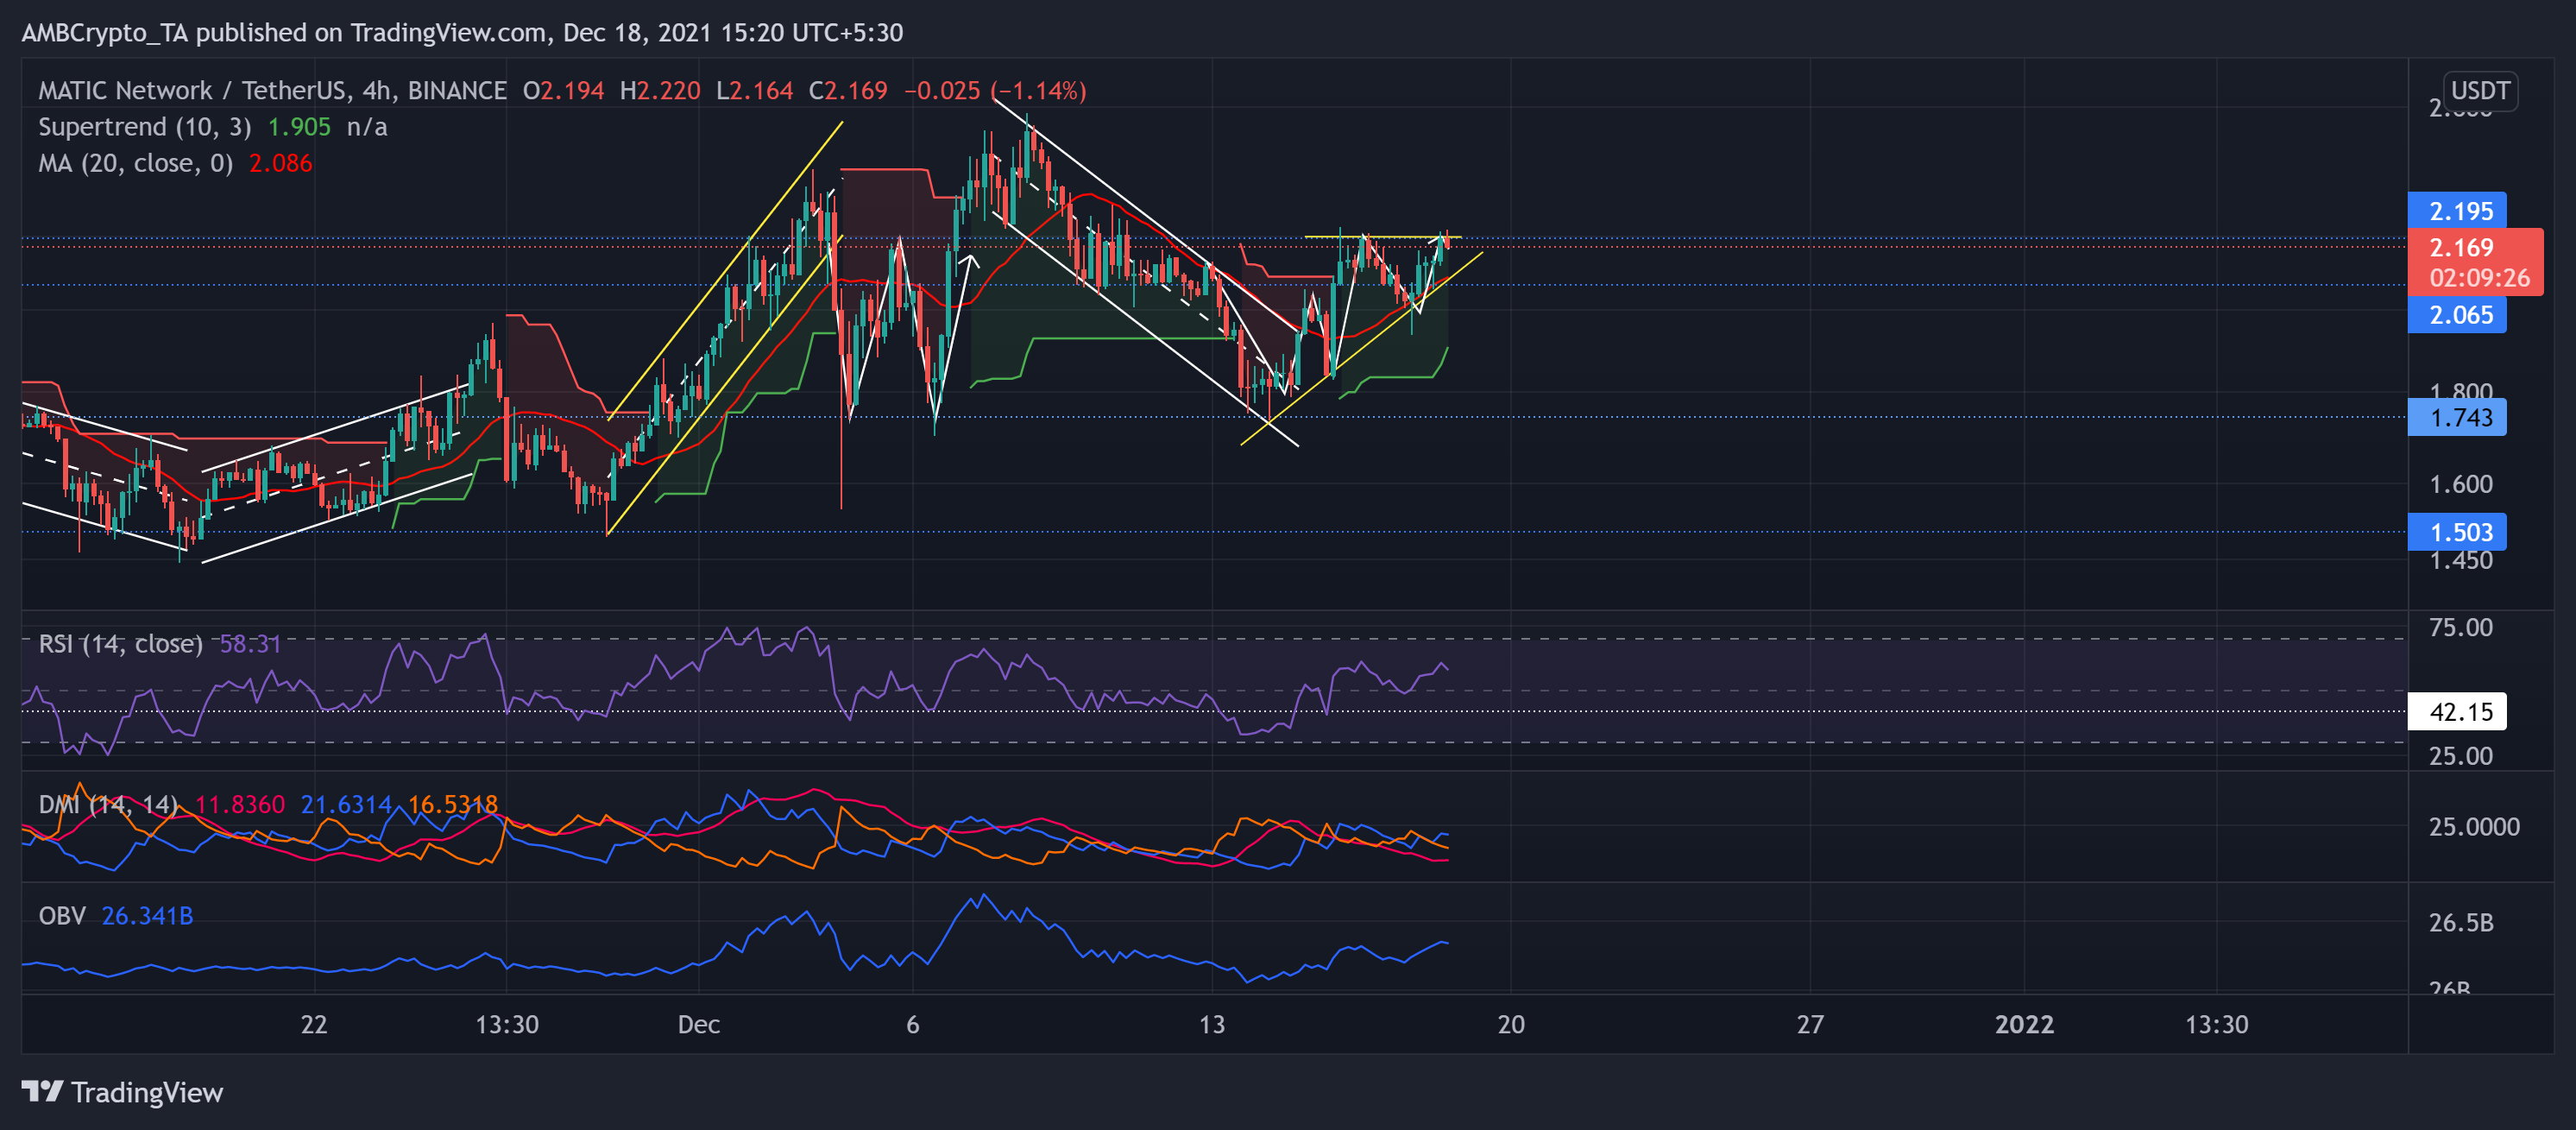
MATIC truly saw a dynamic trajectory over the past month as it refrained from committing to a near-term trend. Its price action marked higher lows while witnessing a flatter upper trendline (yellow) at the $2.195-mark, forming an ascending triangle on its 4-hour chart.
The recent down-channel breakout reignited the near-term bullish force while the Supertrend flashed buy signals.
Now, the immediate support stood near the 20-SMA (red) at the 2.065-mark. Also, the rising lower trendline (yellow) coincided with this level.
At press time, MATIC traded at $2.169 after an over 6% gain in 24 hours. The RSI favored the bulls after surging by 10 points over the past day. Also, the OBV visibly depicted the increased buying pressure in the near term. Further, the DMI affirmed the increased bullish power while the ADX displayed a weak directional trend for MATIC.
The Sandbox (SAND)

Similar to MATIC, SAND marked higher lows while witnessing a flatter upper trendline (yellow) at the $5.2-mark, forming an ascending triangle on its 4-hour chart.
Over the past few days, it moved in a down-channel (white) and seemed to find support at the golden 61.8% Fibonacci level. At press time, the alt traded at $5.2208 after noting a 6% 24-hour gain.
The RSI was northbound after noting a sharp surge. Also, the DMI displayed a bullish bias. But the ADX depicted a weak directional trend. Regardless of the bullish tendencies, the OBV did not seem to suggest a sharp increase in buying pressure.