


Disclaimer: The information presented does not constitute financial, investment, trading, or other types of advice and is solely the writer’s opinion.
- MATIC broke out of a short-term range.
- The next area of interest lies at the psychological $1.5.
Polygon saw increased activity in the DeFi space in recent days. Its native token MATIC also had positive returns of 80% in the past six weeks. This is an impressive performance for a crypto asset with a market cap of $11 billion.
Read MATIC’s Price Prediction 2023-24
Bitcoin fell beneath the $23k mark. Alongside BTC, many altcoins saw a lower timeframe bearish market structure break. MATIC was not one of these assets. Is this a sign that MATIC will rally hard in the event of a bounce in BTC prices?
Range highs retested as support for MATIC and new highs are in sight
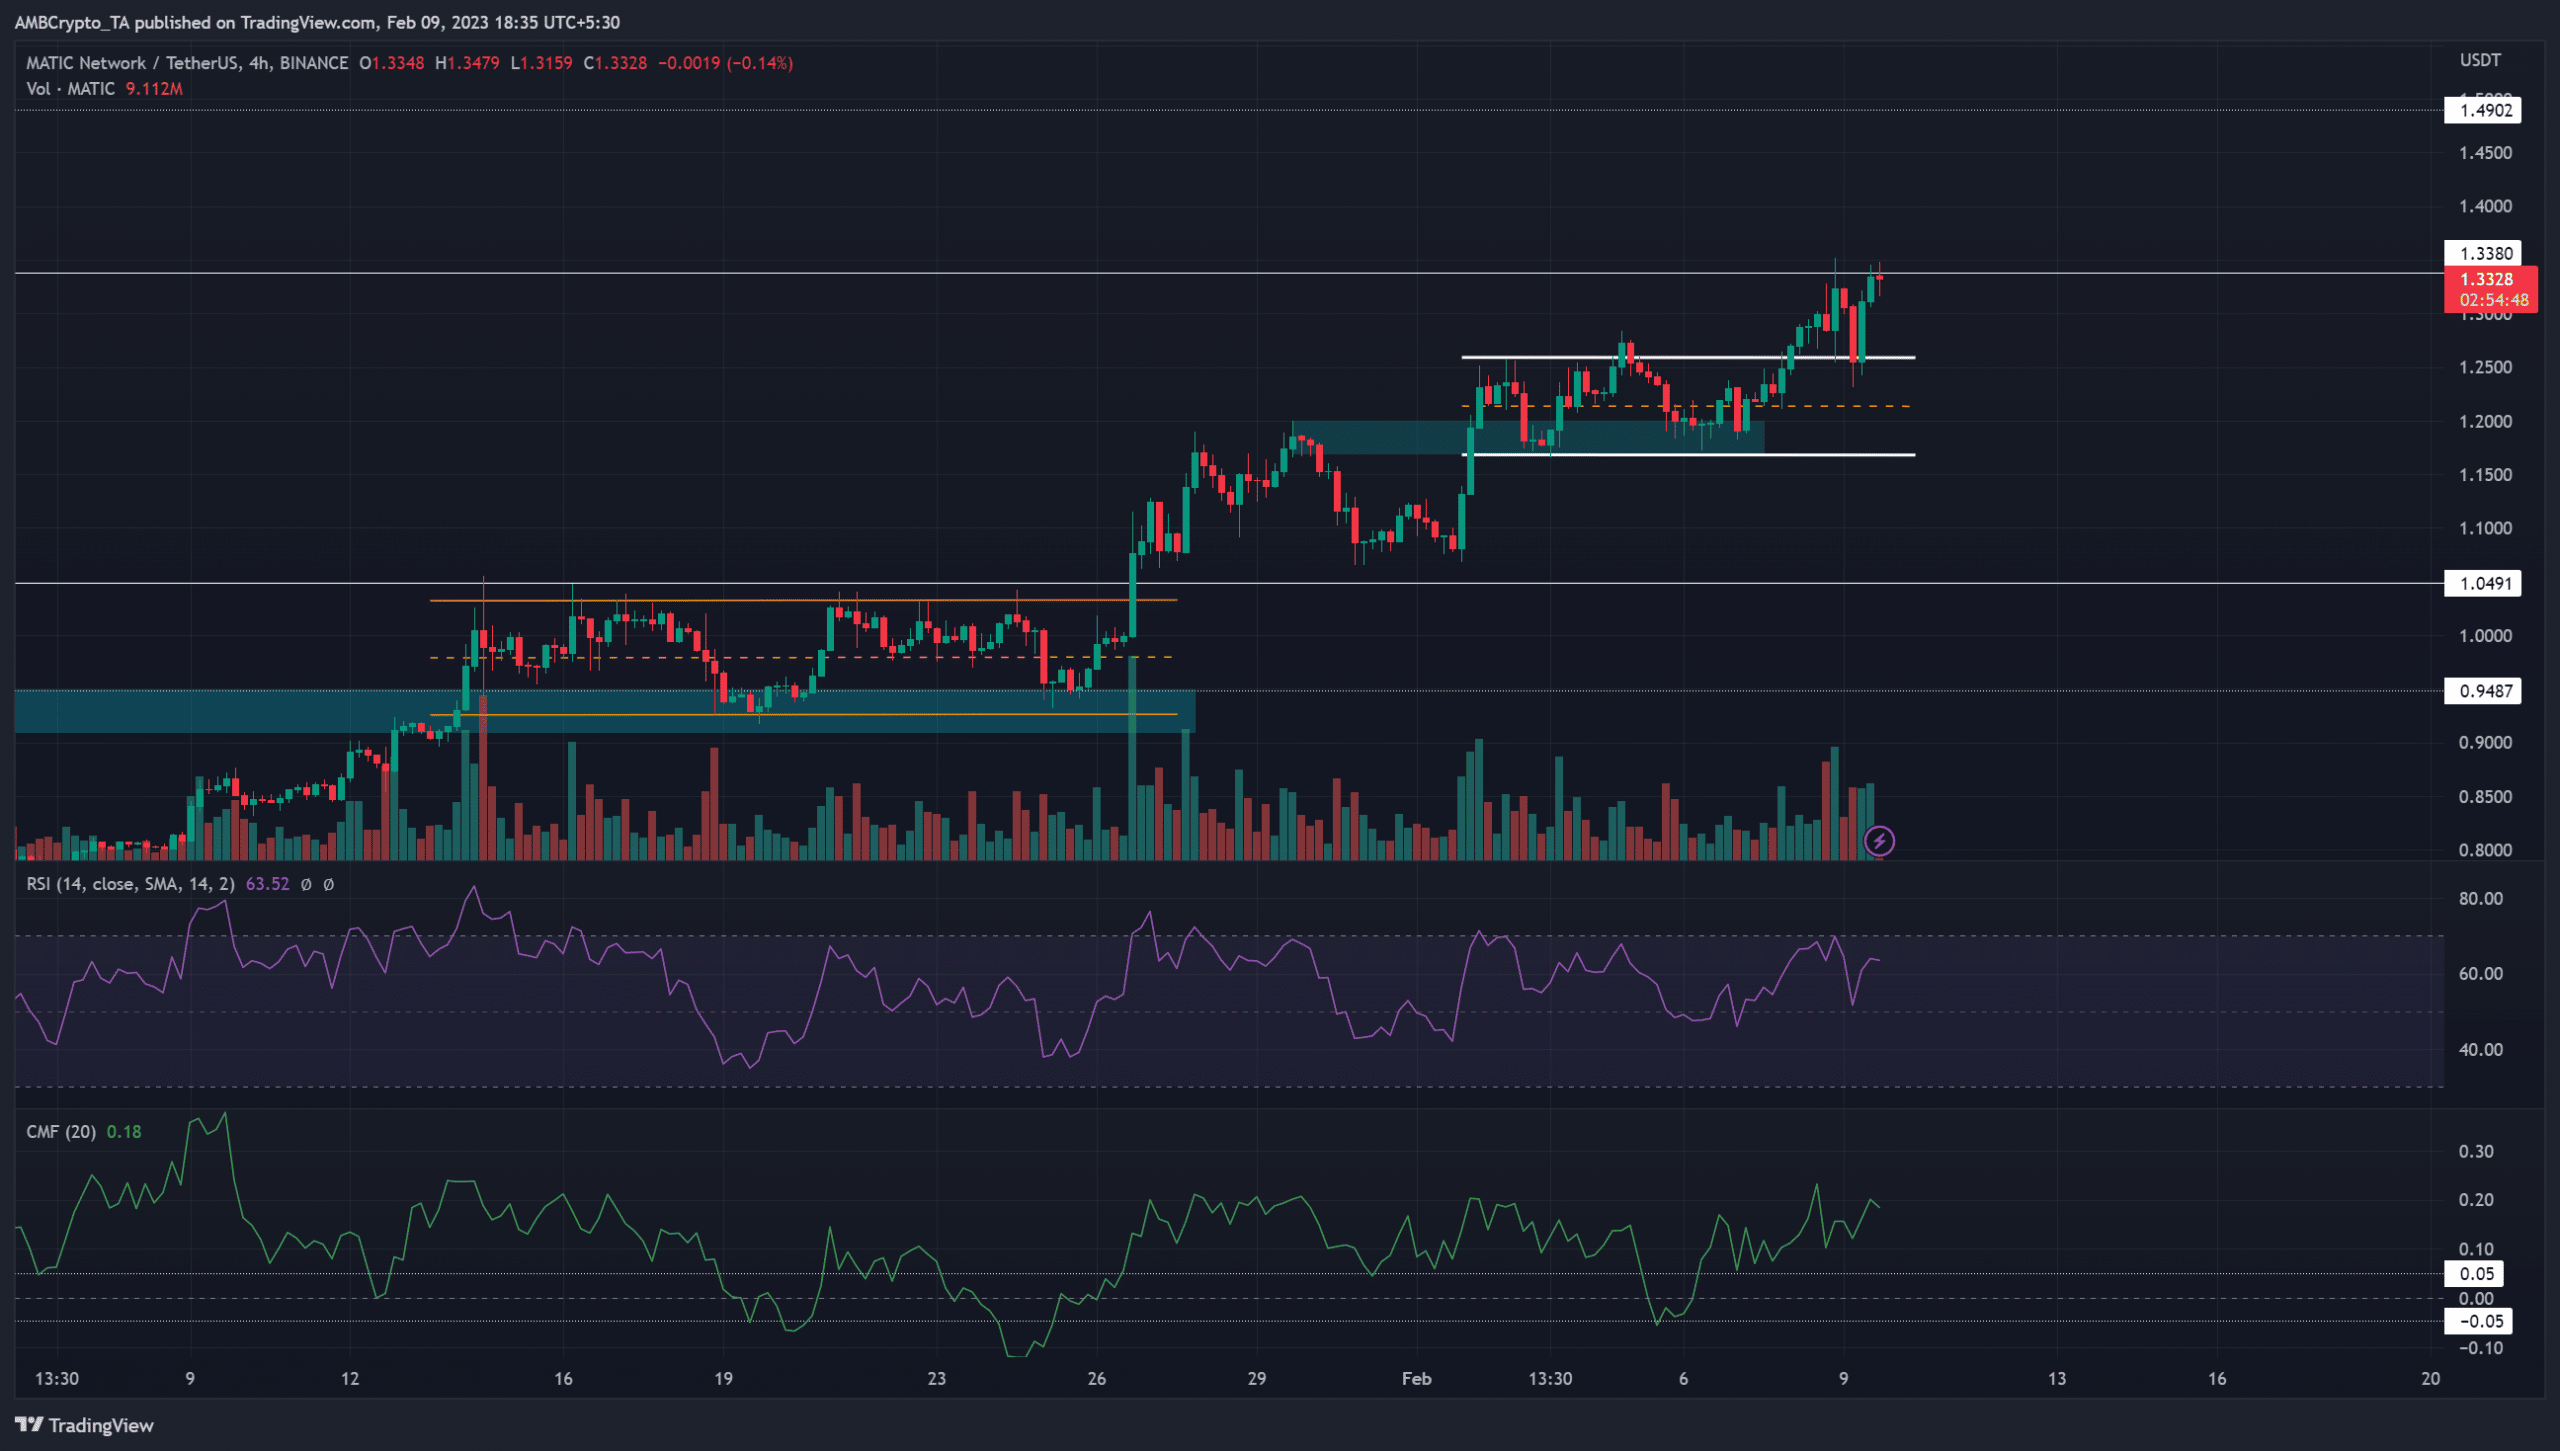
In early February, MATIC formed a range on the price charts. This range extended from $1.16 to $1.26 with the mid-point at $1.21. The range lows had confluence with a bullish breaker (marked in cyan) on the 12-hour chart.
Is your portfolio green? Check the MATIC Profit Calculator
This retest was followed by a break out past the $1.26 level. Moreover, a move above the range highs was accompanied by an increase in trading volume as well.
This price expansion alongside volume increase was a strongly bullish sign that MATIC is one of the stronger assets in the market.
The CMF was well above the +0.05 mark to show significant capital flow into the market. The RSI also stood at a healthily bullish value of 63.
This indicated an uptrend in progress. The indicator agrees with the series of higher lows that MATIC has formed since early January.
Open Interest soars alongside price as bulls seize the initiative
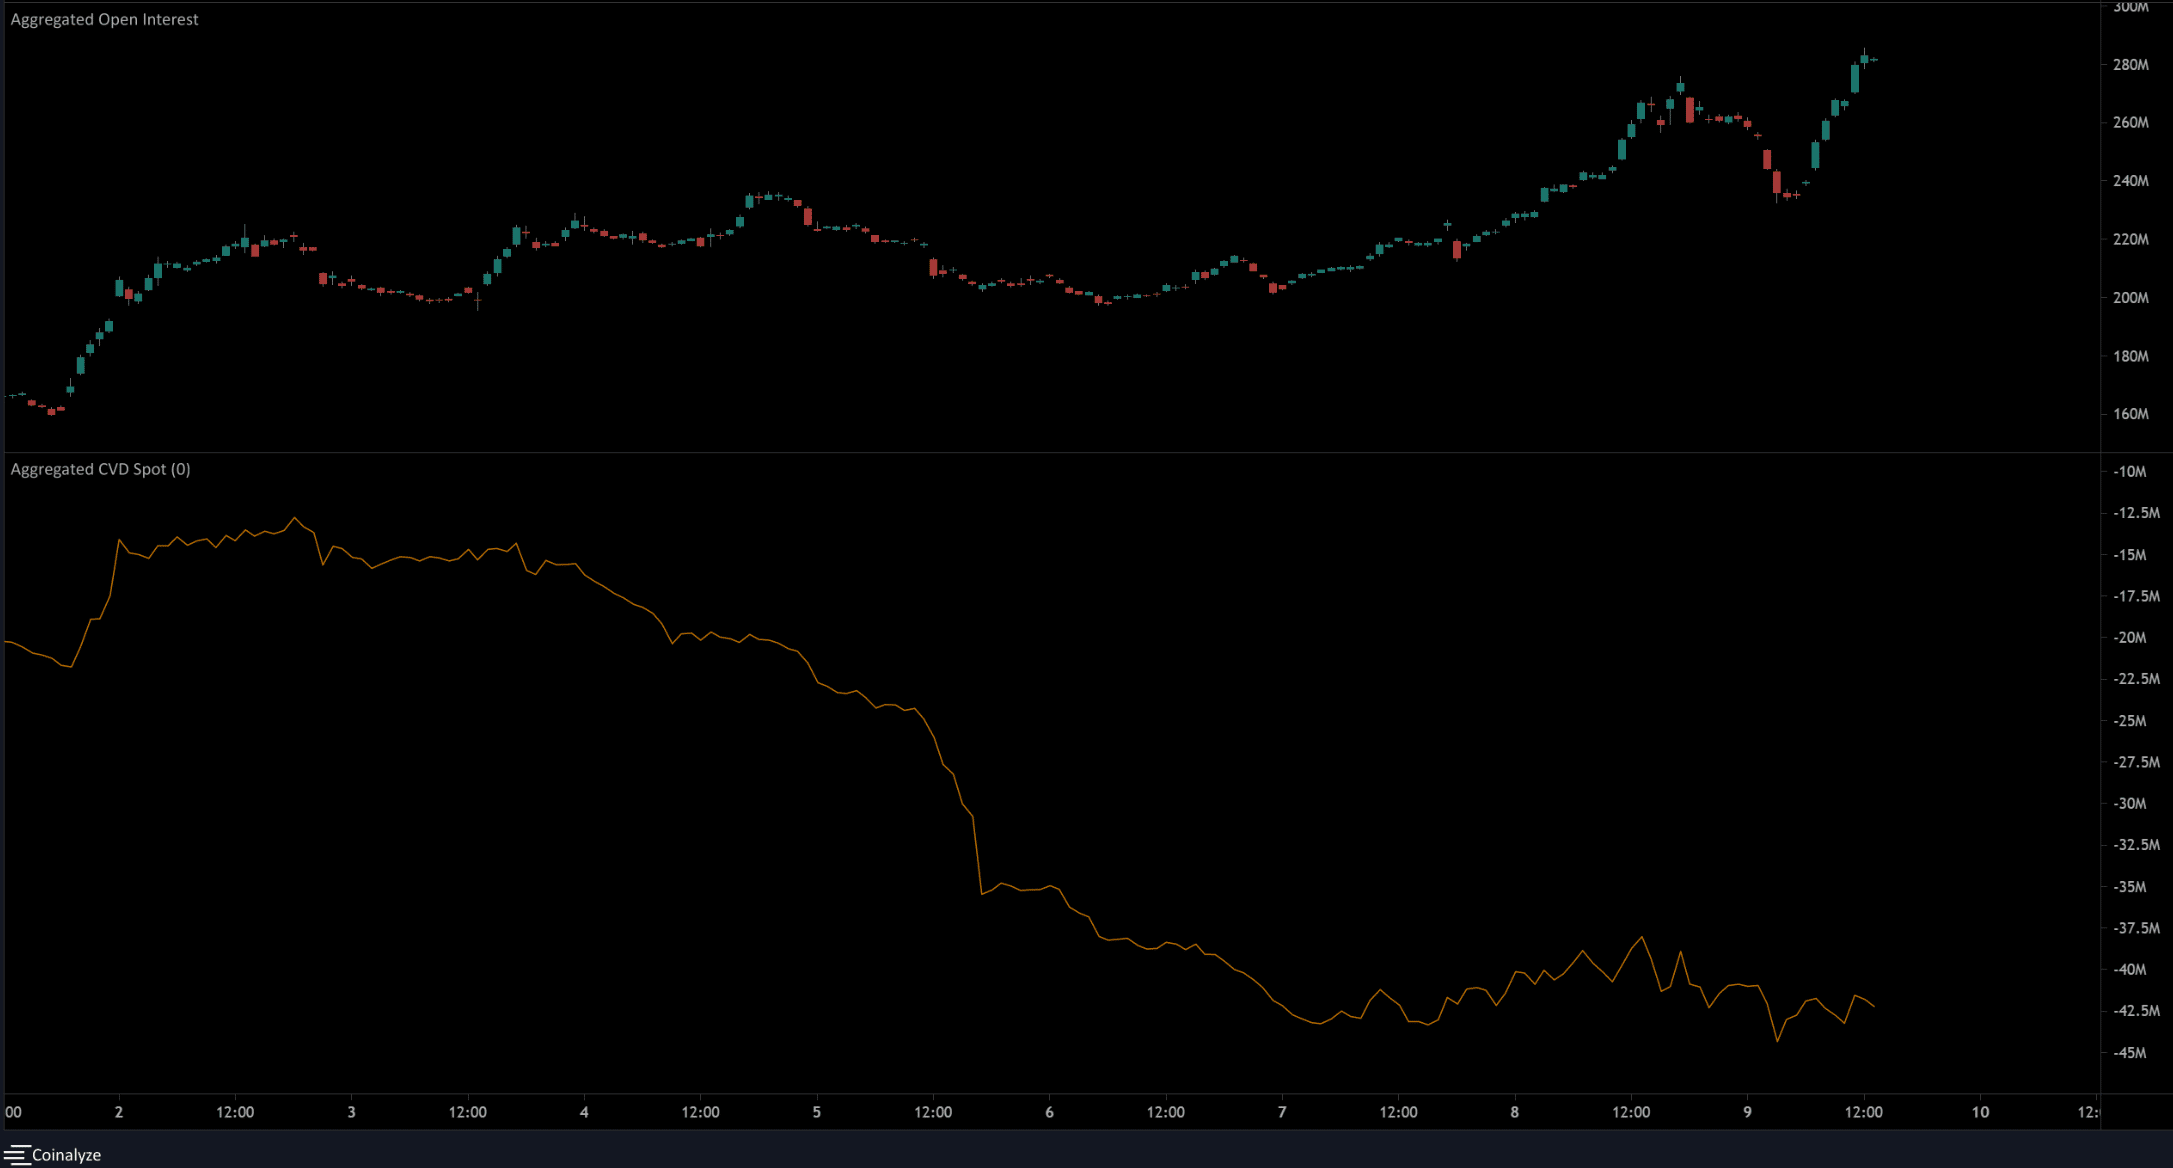
The Open Interest saw a strong surge as the price broke past the $1.26 resistance. This signaled capital flow into the market and bullishly positioned market participants. The spot CVD, which had trended downward from 2 February, remained flat in the past couple of days.
Taken together, the lack of an uptick on the spot CVD front was slightly concerning. This was outweighed by the bullish sentiment seen on the OI and the price chart indicators.
Over the next two weeks, it is possible that MATIC forms another range and retests the lows before another move upward. $1.49 and $1.7 are resistance levels to watch out for.