MATIC going strong, makes it to all-time high; how much further can it climb

MATIC formed its ATH at $2.7 in May earlier this year. The past couple of days have seen MATIC trade very near the ATH, and climb to $2.73 momentarily as well. A bearish divergence was seen on a lower time frame, and a subsequent dip to $2.57 was readily bought up too.
The bullish pressure behind MATIC has been building for weeks now and could drive MATIC to $3 or even higher. However, $2.52 was a level bulls would not want to see the price drop beneath.
MATIC
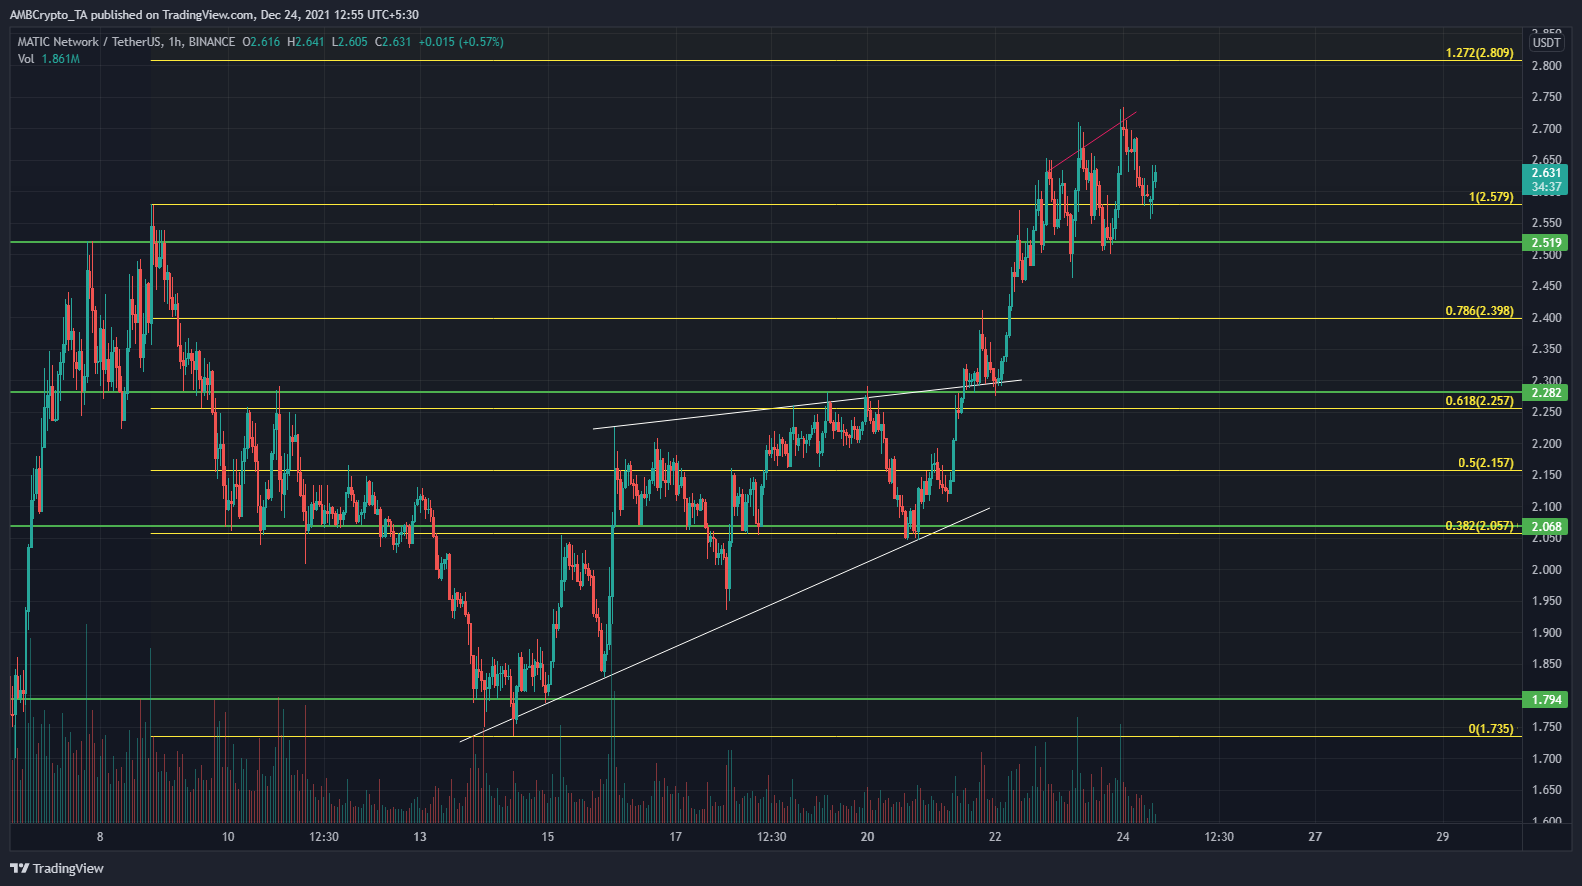
The Fibonacci retracement tool was used to plot some levels of retracement for MATIC, based on its move down from $2.579 to $1.735. Alongside the retracement levels, higher time frame support levels (green) were also plotted.
The two sets of levels had some confluence at the $2.05 mark and the $2.25-$2.28 area. Hence, these levels assumed greater significance. Over the past few days, a wedge pattern also formed (white), and MATIC broke out above the upper trendline and retested it as support.
The $2.57-$2.6 is a short-term level of significance. Price had climbed to $2.69 and retested this area for buyers in recent hours. As long as price doesn’t drop back beneath the $2.52 level, it remained likely that MATIC would push higher.
Rationale
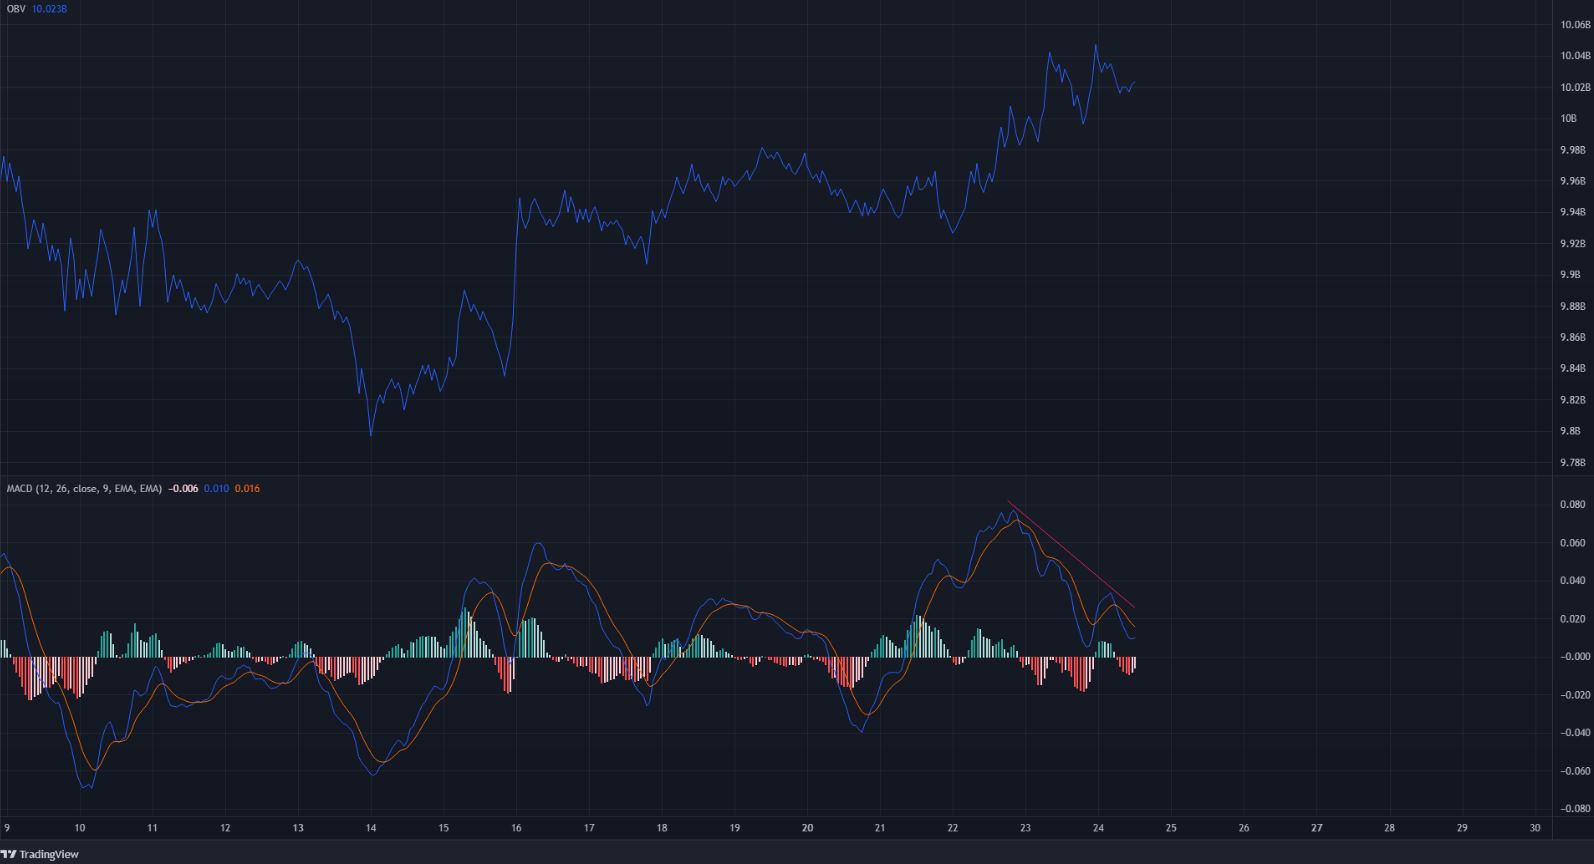
The OBV made a series of higher lows in recent days to denote strong buying pressure. Momentum in the near term also looked bullish, and a pullback to the $2.57 level has already occurred.
On the MACD, highlighted in pink was a bearish divergence- the MACD made lower highs while the price made higher highs. This divergence was followed by a minor dip to $2.57. However, it was likely that MATIC would continue to climb.
On higher time frames, since mid-November, MATIC has formed higher lows at an increased frequency, which indicated that the parabolic move was likely upon us. This could take MATIC to $2.8 and $3.1, which are the 27.2% and 61.8% extension levels of the move plotted on the price chart.
Conclusion
MATIC was strongly bullish on the charts. The $2.57-$2.6 area, alongside the $2.52 level, are areas to watch in the near term. If the price moves below these, a further pullback could occur. However, at the time of writing, it appeared likely that MATIC could push toward $3 in the coming days.


