MATIC in steady downtrend, here’s where you can look to go short
The OBV and the RSI were in bearish favor on the daily timeframe, but the rising mean coin age was an encouraging sight for the buyers.

Disclaimer: The information presented does not constitute financial, investment, trading, or other types of advice and is solely the writer’s opinion.
- The order block and fair value gap hinted that MATIC could see a small rally to fill the gap.
- The strength of the downtrend meant traders should be prepared for a drop beneath the support as well.
On the lower timeframes, Polygon [MATIC] appeared to show some bullish momentum, but it was accompanied by heightened volatility over the past two days. Analysis of the higher timeframes showed that the trend was overwhelmingly bearish.
Read Polygon’s [MATIC] Price Prediction 2023-24
This does not rule out a minor bounce in MATIC prices. The imbalance MATIC left during its sudden plunge beneath $1 on 8 May could be retested. How likely is such a scenario, and should bears take their opportunity upon such a retest?
Will a lower timeframe bull trap be witnessed within the next week?
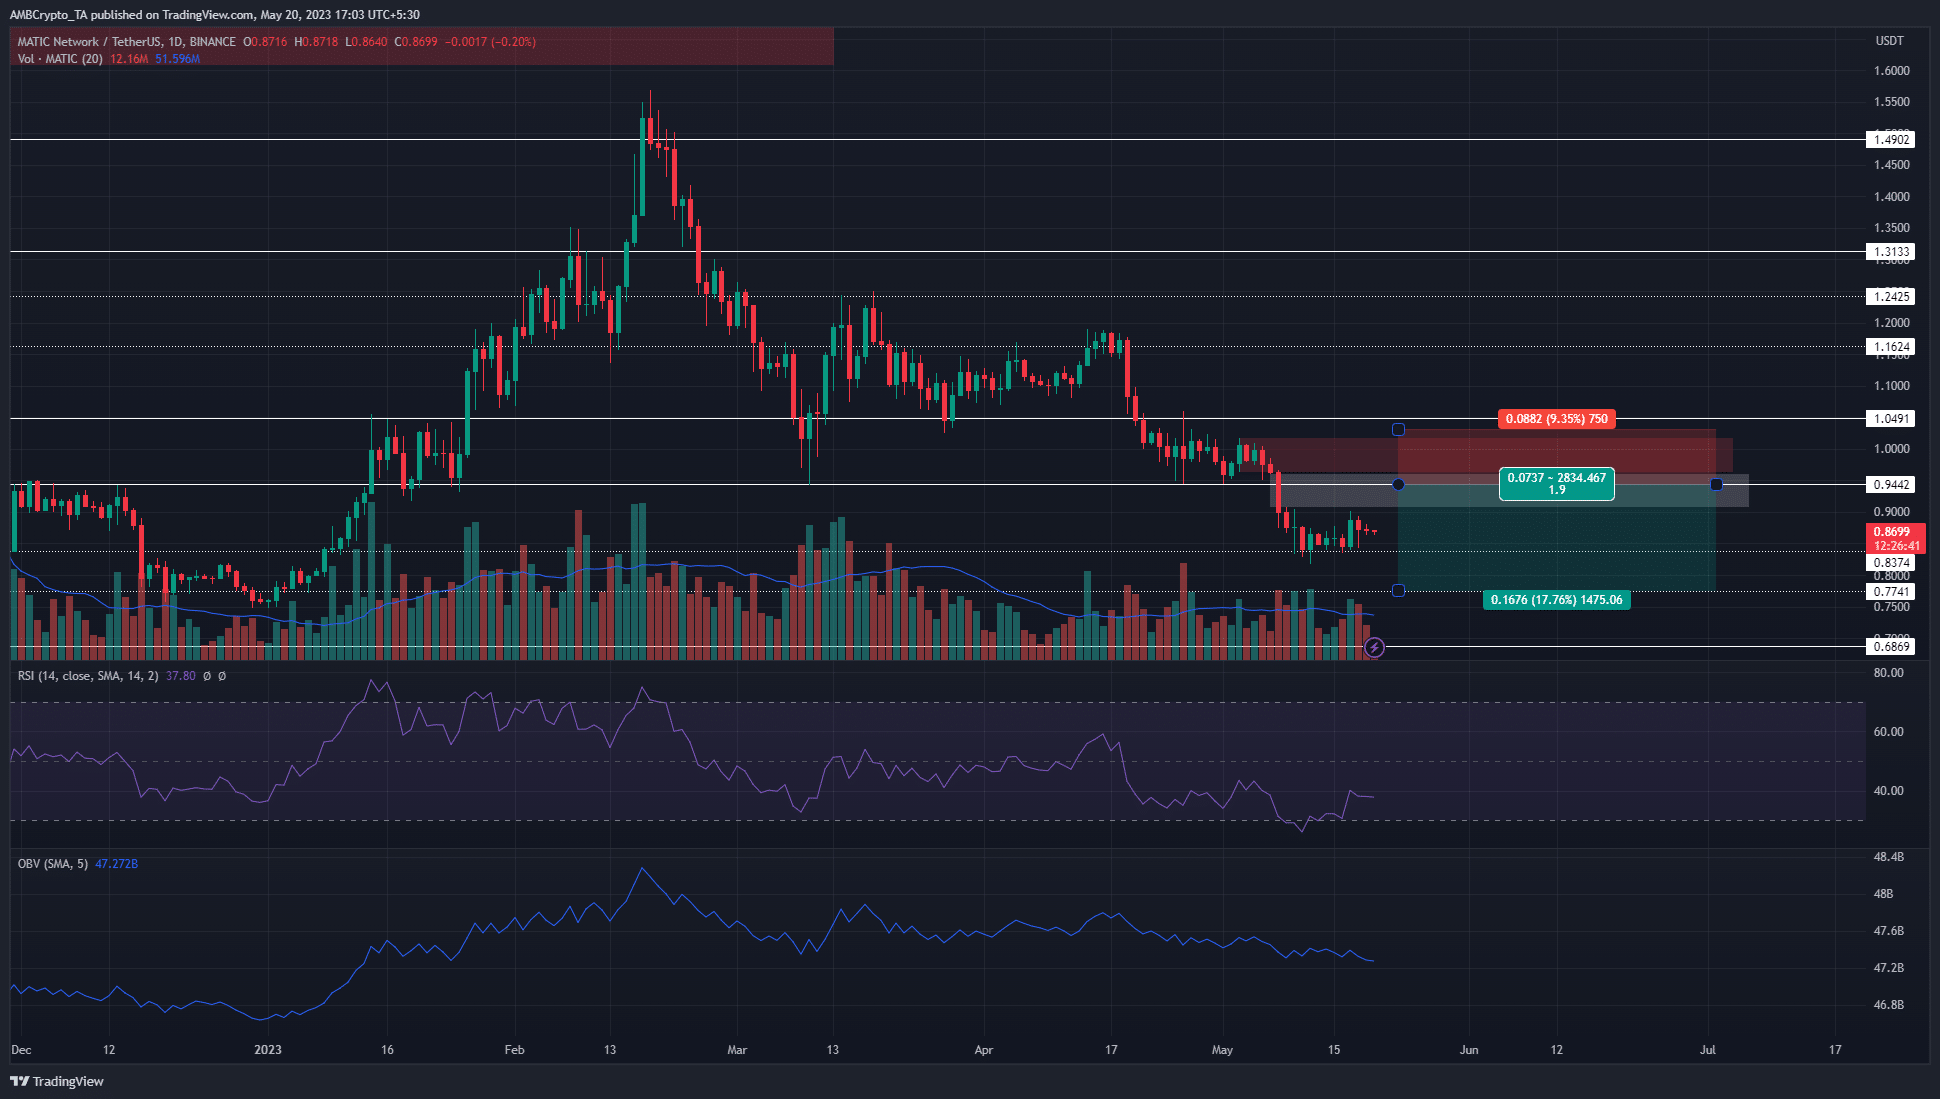
The strength of the downtrend since February has forced MATIC to lose level after level of support. However, each level from $1.3 has been retested. This is not guaranteed to repeat, but suggested that a move upward to $0.9-$1 before another turn downward was not improbable.
Both the OBV and the RSI were in bearish favor. The RSI showed a reading of 37 to denote strong downward momentum. It has been below neutral 50 on the daily chart since mid-April, which highlighted the bearish trend of the past month.
The OBV was also in decline since mid-April. Even in March, it did not climb higher by a significant margin despite MATIC’s bounce from $0.94 to $1.24. From a price action perspective, an imbalance (white) and a bearish order block (red) were present in the $0.9-1.02 area. It was possible that a lower timeframe rally to this area would be followed by rejection, which short sellers can look to capitalize on.
How much are 1,10,100 MATICs worth today?
Spike in dormant circulation highlights a wave of selling
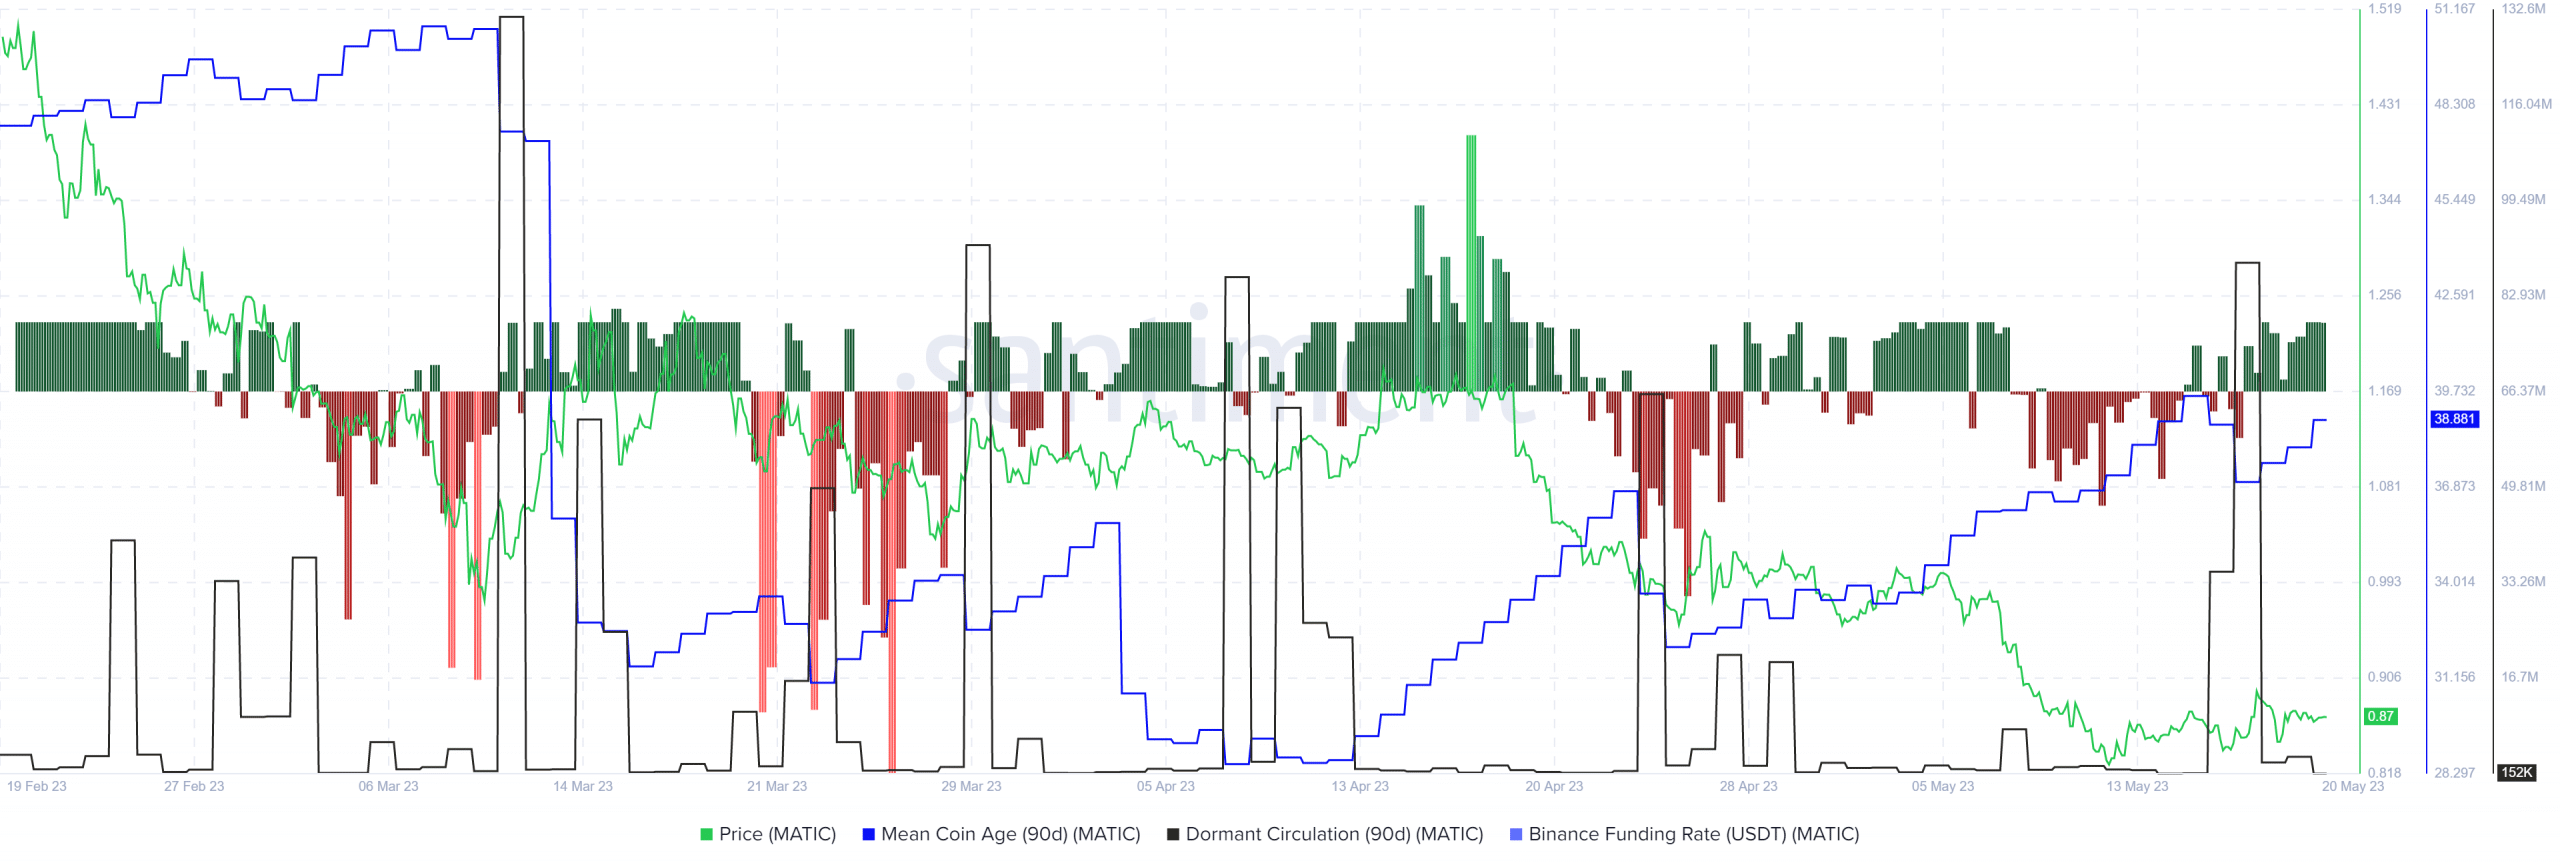
On 17 May, the 90-day dormant circulation surged to two-month highs. The funding rate also dropped into negative territory momentarily in response to the pressure from the bears. Yet, MATIC did not fall beneath the $0.84 support.
The funding rate has been positive since then, and the price bounced by near 3% since then to trade at $0.87 at press time. An encouraging factor for the buyers was the rising mean coin age. This uptrend meant that MATIC bulls were accumulating the asset. It remains to be seen whether they can force a breakout past the $1 resistance, which is also a psychologically important area.


