MATIC shows a short-term bullish stride but buyers must beware of this

Disclaimer: The information presented does not constitute financial, investment, trading, or other types of advice and is solely the writer’s opinion.
- The momentum and volume indicators showed the buyers did not have a clear upper hand
- The liquidity pocket at $0.57 was attractive, but it was unclear if MATIC could make the leap to reach that level
Polygon [MATIC] saw a decline in total value locked (TVL) and daily transactions in August. On 14 September Polygon announced the implementation of Polygon 2.0 and 3 Polygon Improvement Proposals were released.
Read Polygon’s [MATIC] Price Prediction 2023-24
The price has been climbing slowly higher over the past week but the higher timeframe trend remained firmly bearish. Yet there was a chance that the price could see a bounce in the coming days.
The market structure leaned in bullish favor
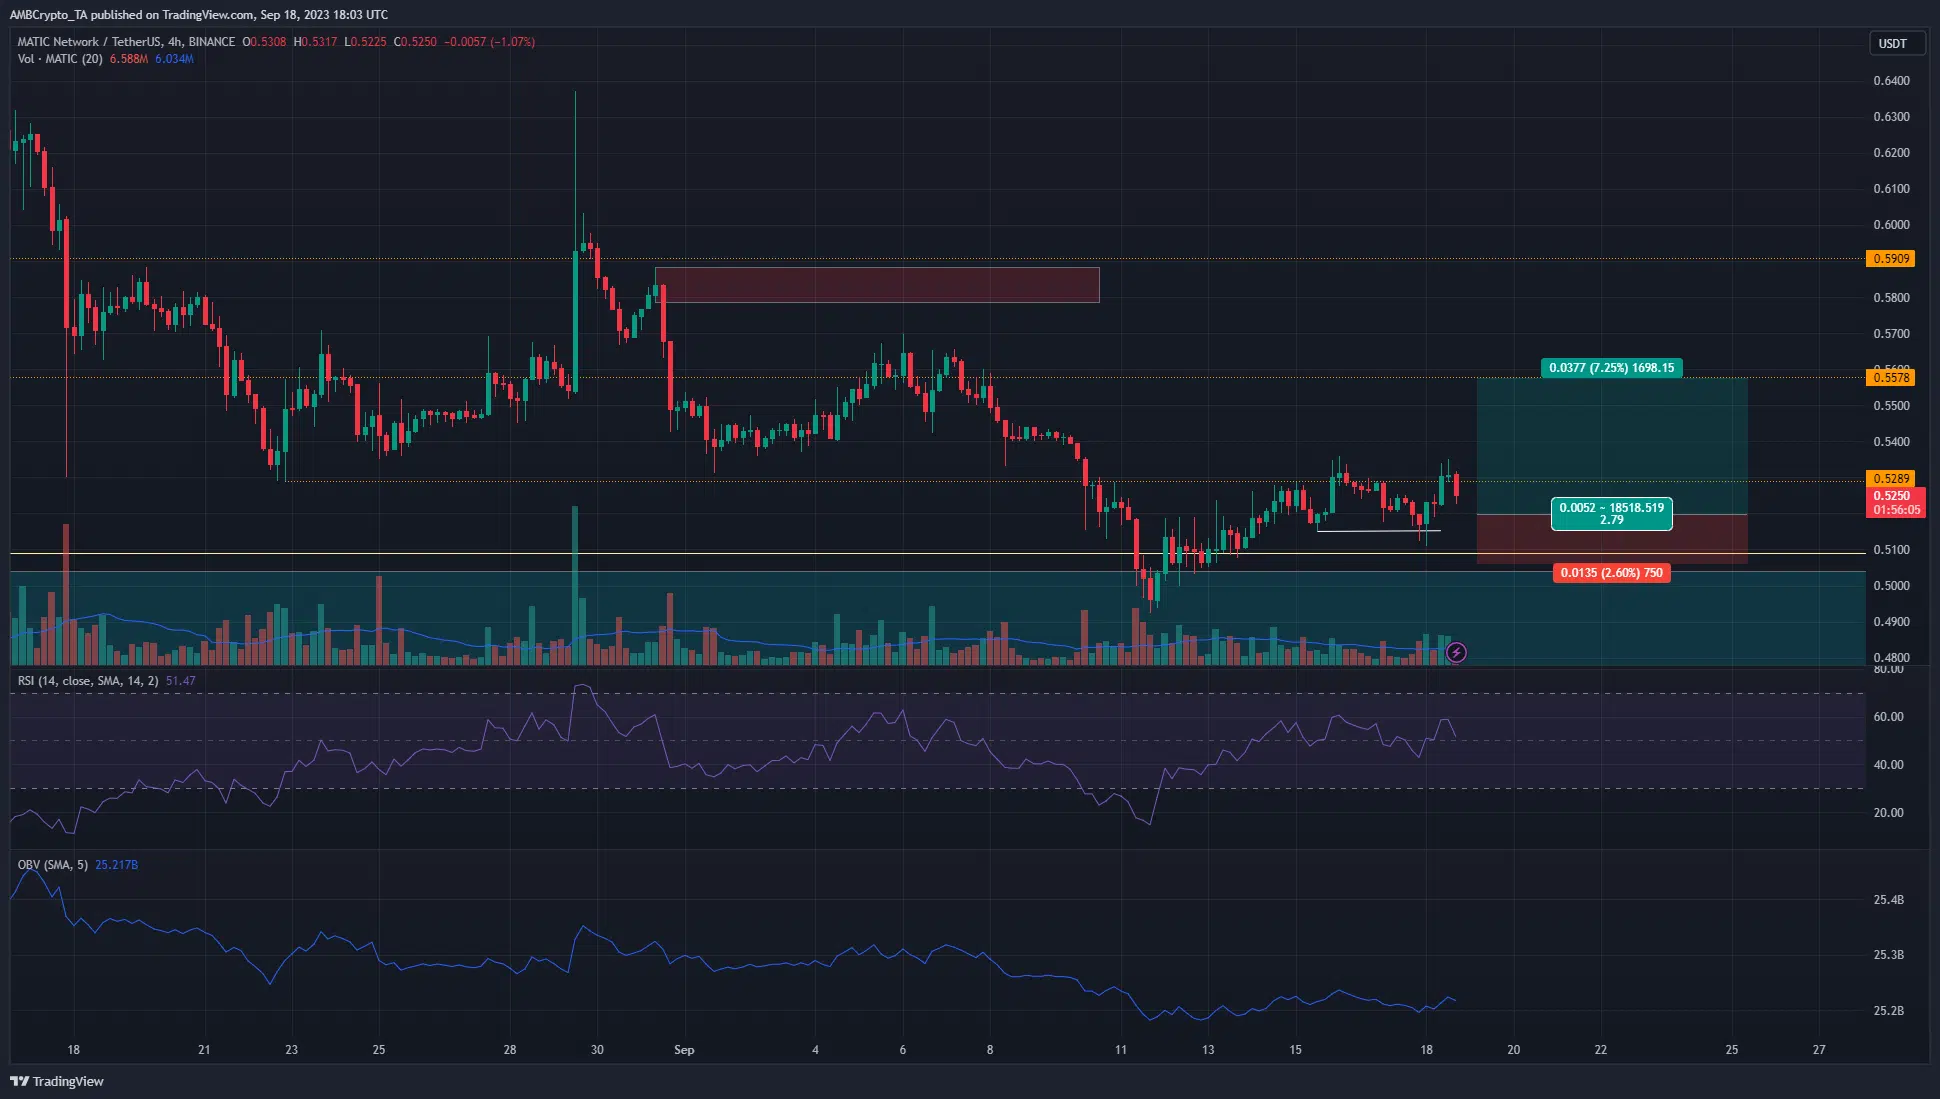
On the four-hour chart, MATIC climbed to $0.536 on 16 September. The previous lower high was at $0.529 on 10 September, which meant the recent bounce broke the bearish market structure. Moreover, the higher low at $0.515 was also defended in recent hours and another to $0.53 was registered.
This highlighted some bullish intent in the short term. The Relative Strength Index (RSI) was above neutral 50 to show bulls could drive prices higher. The On-Balance Volume (OBV) noted a minor move higher since 13 September. The OBV signaled some buying pressure was present in the market. However, trading volume has been quite muted in the past few days.
On the one-day chart, the recent lower high was at $0.57, which meant it was an attractive liquidity pocket for MATIC to retest before continuing its higher timeframe downtrend. Given the slightly bullish outlook on the four-hour chart, a buying opportunity was present, although it could be risky.
The market sentiment showed bulls can remain cautious

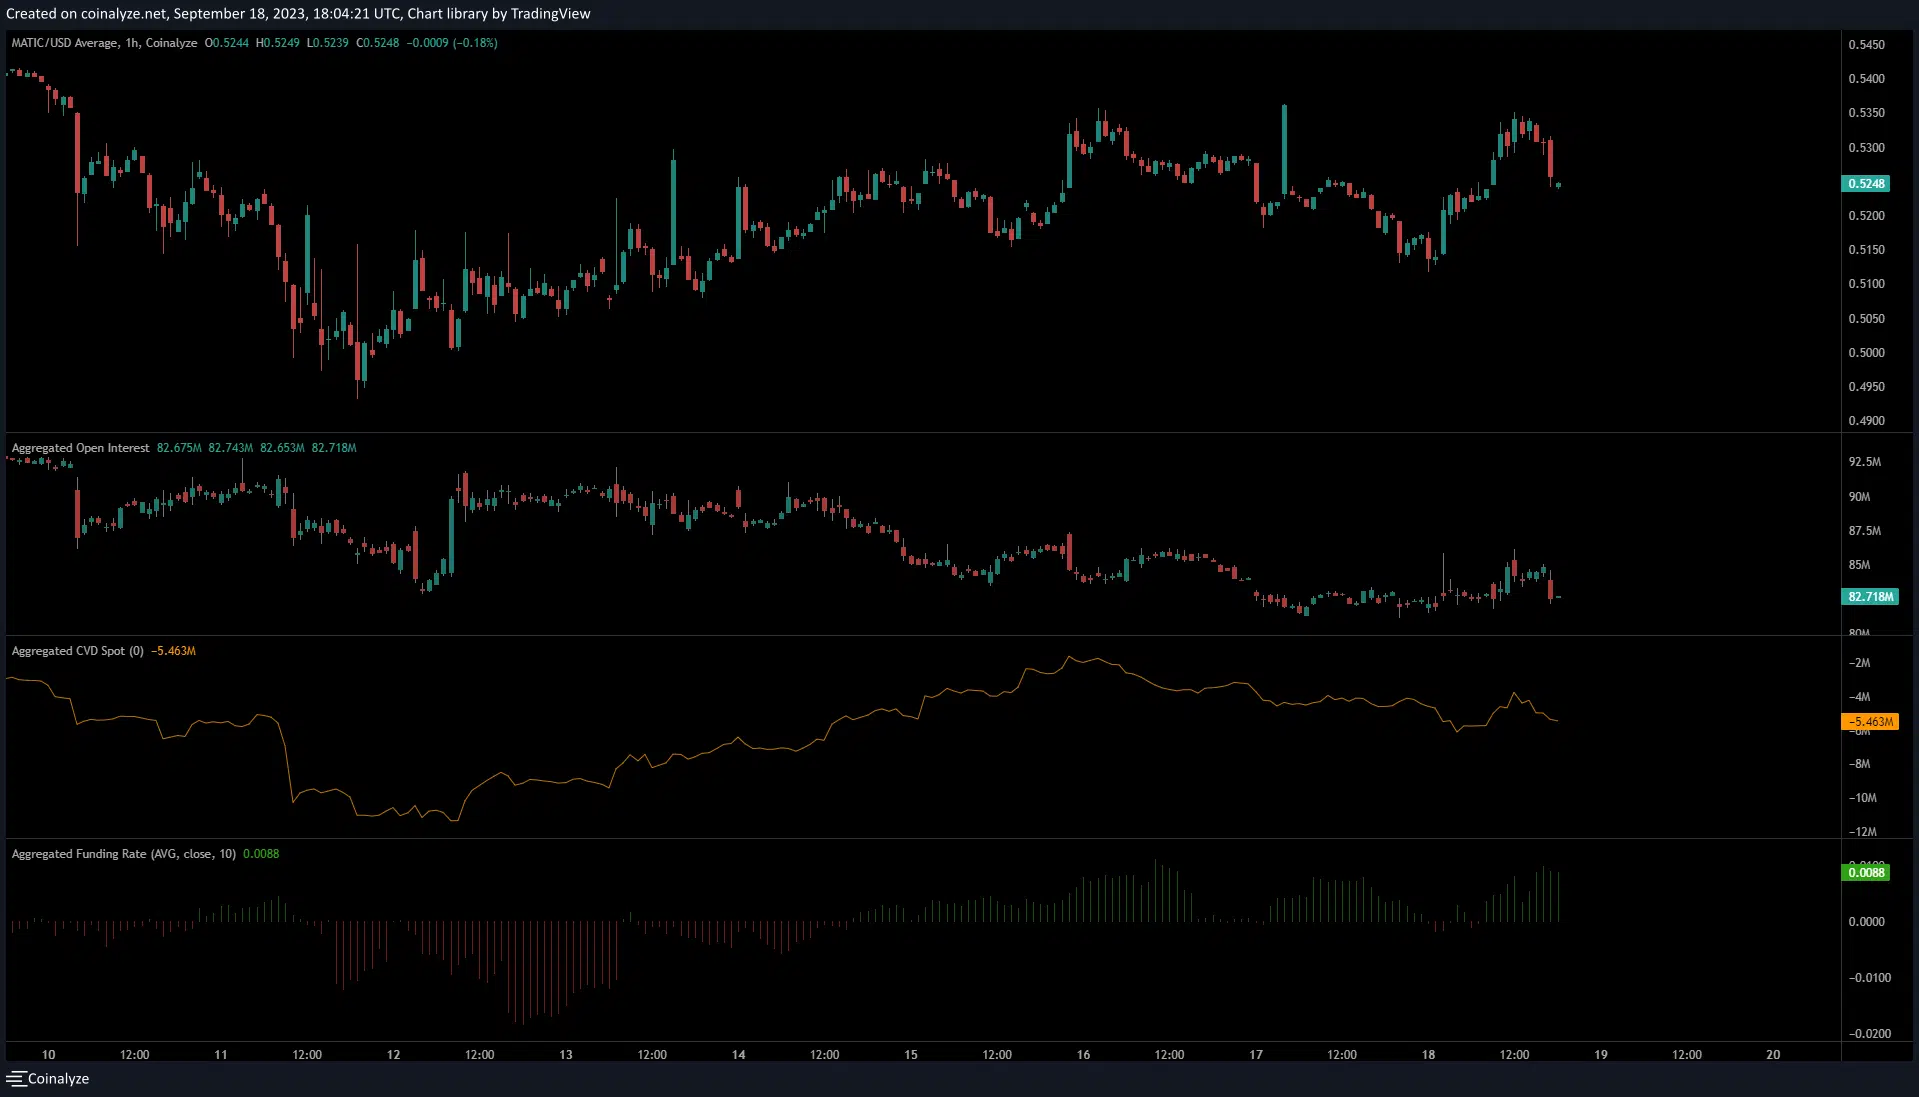
Source: Coinalyze
While MATIC climbed from $0.511 to $0.534 in the past 24 hours, the Open Interest hardly climbed higher. The meager bounce the OI saw was quickly extinguished upon a lower timeframe dip from $0.534 to $0.522. The inference was that speculators were wary of bidding, and were quick to book profits and exit the market.
Is your portfolio green? Check the MATIC Profit Calculator
The spot CVD also witnessed a downtrend since 16 September, which highlighted a lack of demand over the weekend. Even though the funding rate was positive, MATIC bulls can wait for a move toward the recent lows at $0.511 before looking to bid.


