MATIC, Solana, Litecoin Price Analysis : 13 June

Bitcoin lost a solid 6.5% in the last 24 hours and total market capitalization fell by 3.77% to remain at $1.492 trillion. While Solana and Litecoin had been trading in red on the 4-hour chart, MATIC seemed to be making a green run for itself.
MATIC :-

MATIC reached close to its ATH back on May 26 and has since been on a consistent downtrend. Within the span of 18 days, the coin’s price dropped by 41.32%, trading at $1.36 at the time of writing. While Relative Strength Index was at the oversold zone 12 hours ago, it has since climbed back up to the neutral line thanks to strong buying pressure.
Bullish momentum could be observed on Awesome Oscillator in the last 12 hours, with the presence of green bars under the neutral line at press time. Regardless, Parabolic SAR displayed an active uptrend as the white dotted line was present underneath the candlesticks.
Positive momentum in the market saved the coin from falling below the $1.23 support level and stronger buying cues could move the price further upwards.
Solana [SOL] :-
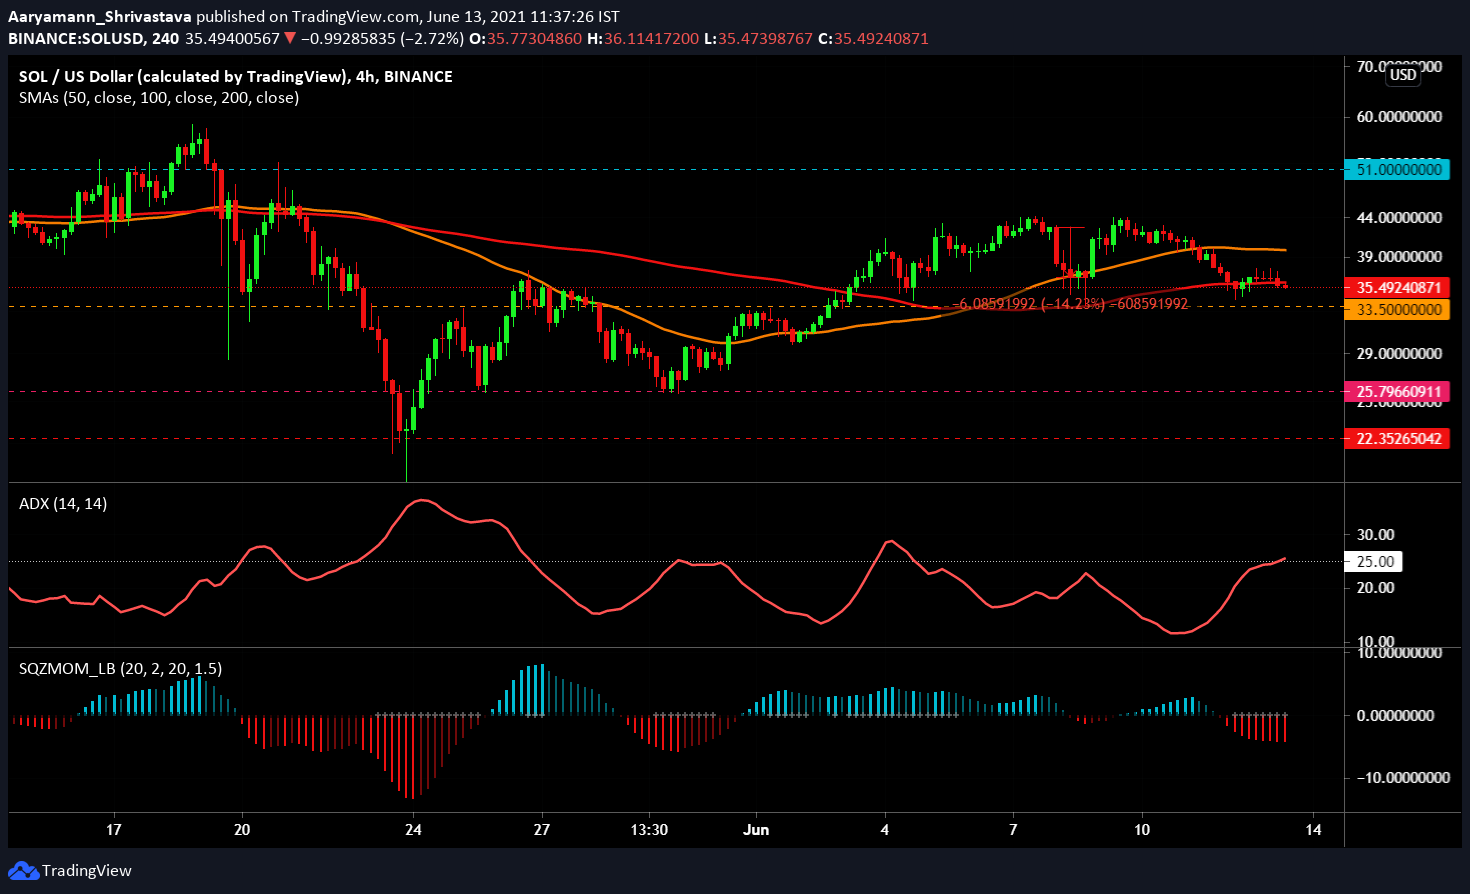
Although SOL has been trading in red for the last couple of hours, it managed to keep its price from falling any closer to the $33.5 support level. At the time of writing, Simple Moving Averages (SMA) lines – 50 SMA (orange) and 100 SMA (red) have different positions on the chart. While 50 SMA remained bearish, 100 SMA was moving closely under the price indicator.
In the recent few observations, Average Directional Index’s (ADX) rise has indicated a price drop. The indicator’s current rise could be a matter of worry if the red line moves above the 25.0 mark. According to the Squeeze Momentum Indicator, SOL was in an active squeeze release ( white dots ), with strong bearish pressure present at the time of writing.
The chances of the coin dropping below the support line seem plausible based on the indicators, which is why another support has been established at $25.7.
Litecoin [ LTC ] :-

Litecoin had been moving just as expected: the coin did not display any severe volatility in the last few days. LTC’s movement remained sideways and consolidated within $185.5 resistance and $145 support level. Even at press time, Bollinger Bands displayed no incoming volatility as the bands remained parallel to each other.
Relative Strength Index (RSI) was well below the neutral line. Selling pressure pushed the indicator to 40.8. Awesome Oscillator on the contrary did exhibit bullish momentum building up as green bars appeared on the indicator.
The coin needs to move above $170 in order to create a significant rally to prevent any further price drops.