Ethereum, MATIC, YFI Price Analysis : 09 June

While Bitcoin has been losing market dominance every week, Ethereum has been capitalizing on it, increasing its market share to a solid 18.9%. This week, Polygon (MATIC) was in the news regarding its upcoming project Aavegotchi which combines NFTs, DeFi, and DAOs. Sharing the spotlight was yearn.finance ( YFI ) as its developer talked about plans to work on new vaults and verticals
Ethereum [ ETH ]:-
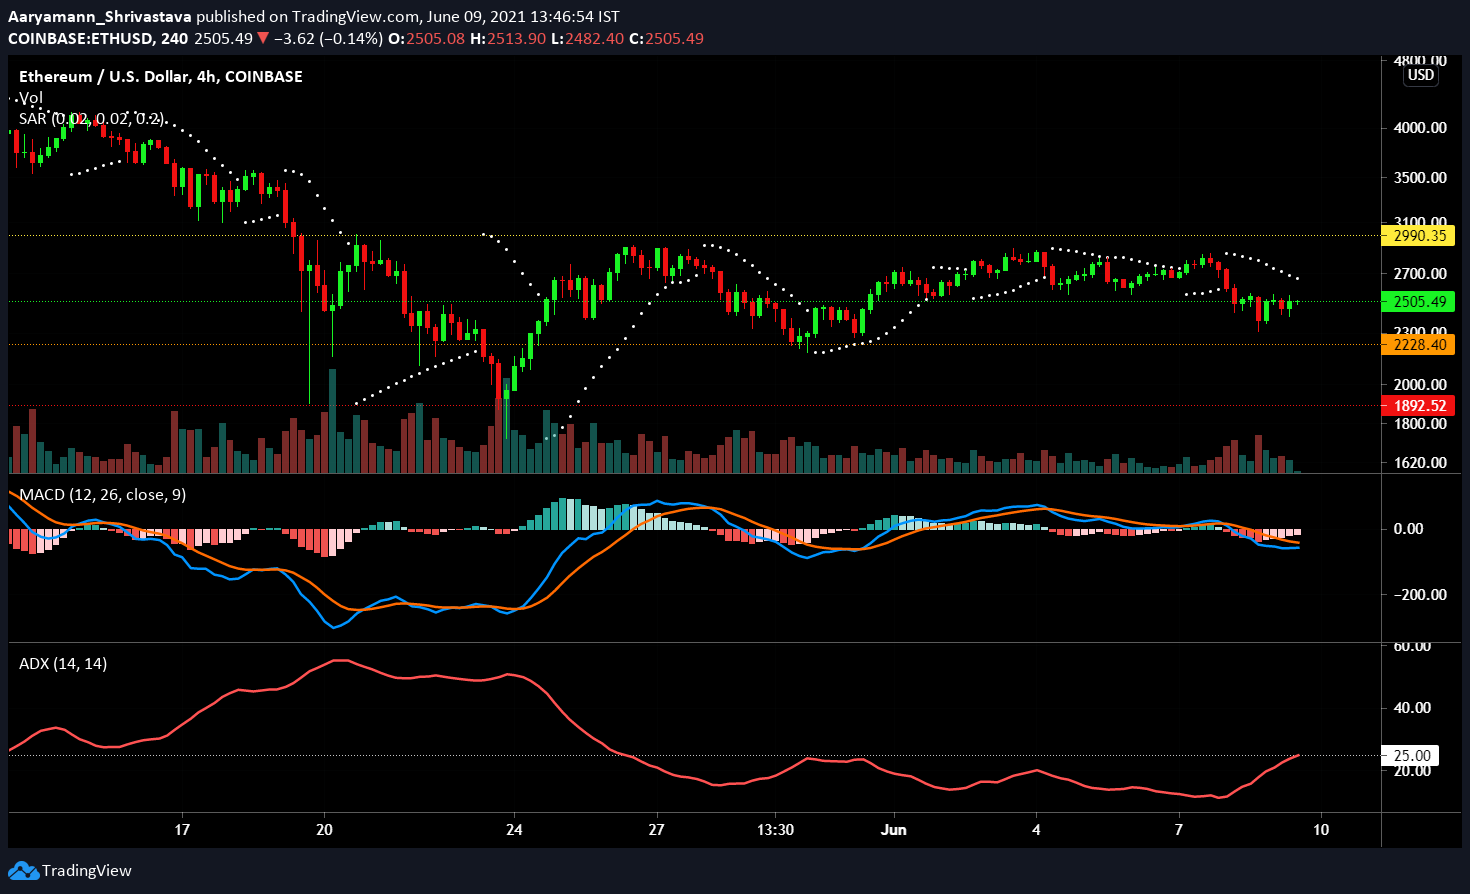
Over the week ETH continued to move within its $2990 resistance and $2228 support level. The coin lost 13.2% in less than 12 hours and at press time traded at $2505. MACD indicated a bearish crossover as the red signal line was above the blue indicator line. However, at the time of writing, both lines maintained their positions close to each other under the centerline.
Parabolic SAR exhibited a strong downtrend as well, as the white dotted line remained above the candlesticks. Furthermore, Average Directional Index (ADX) was rising at press time, yet it was under the 25.0 mark. Should it cross the mark, the downtrend could gain momentum.
If the coin does not face any more negative cues, it could remain safe within the aforementioned support and resistance levels.
MATIC:-
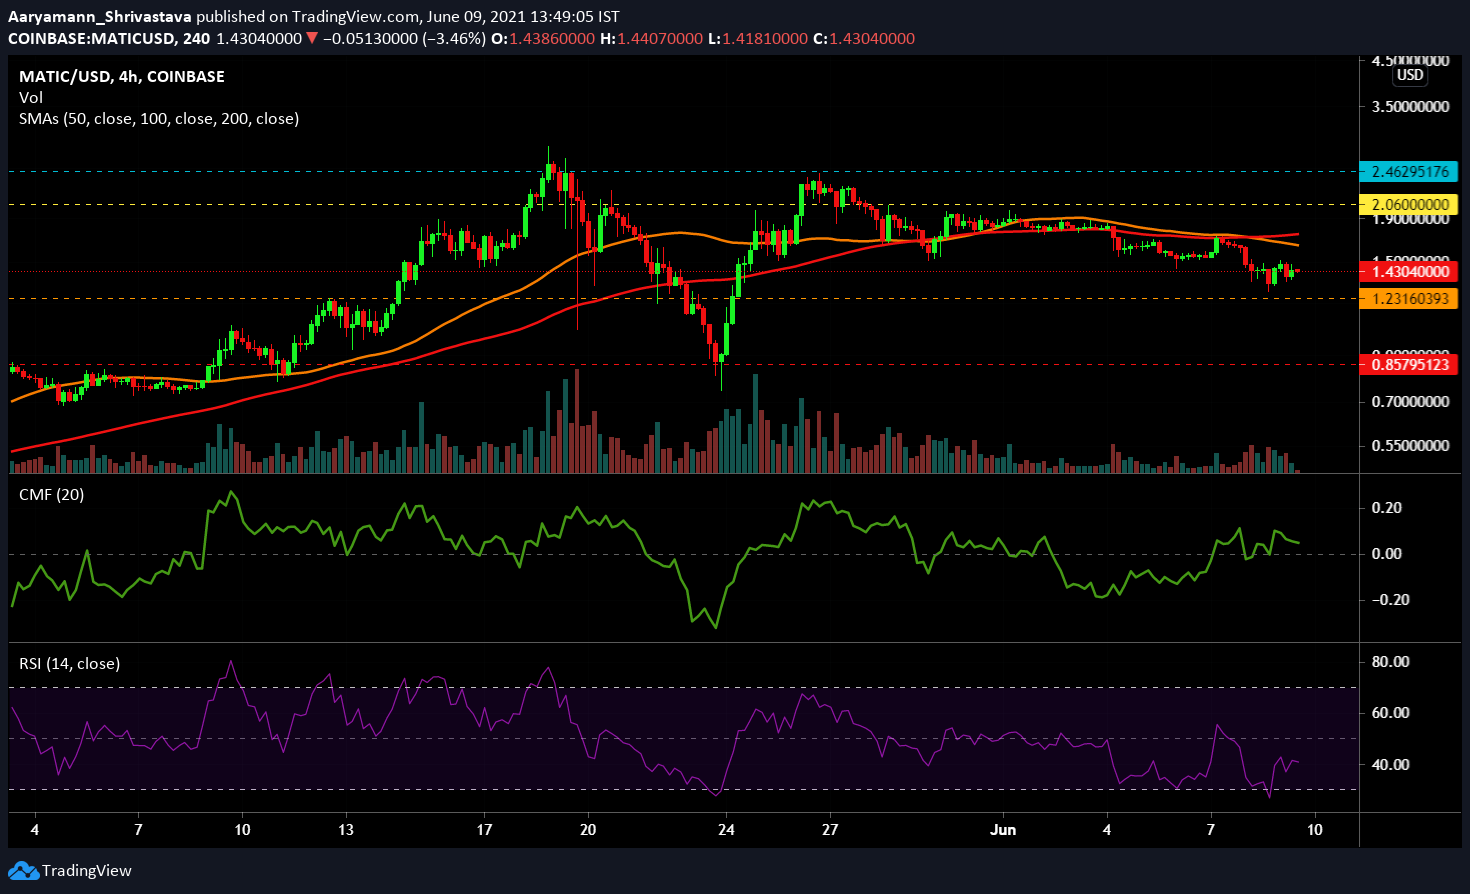
MATIC continued down the path of a downtrend as was expected. At the time of writing, the coin was moving close to its $1.23 support level. Chaikin Money Flow showed that capital inflows have been strong since June 4 and the indicator kept rising moderately. At the time of writing, the green line dipped slightly towards the neutral line.
Relative Strength Index (RSI) displayed positive momentum as buying pressure pushed the indicator from the oversold region. However, at press time, the indicator remained under the 50.0 neutral line. Simple Moving Averages continued to act as resistance. Both 50 SMA (orange) and 100 SMA (red) lines remained above the candlesticks, keeping the price movement strongly bearish.
If the price falls further, $0.85 will act as the next support level for the coin, or else the sideways movement will keep it above $1.23.
yearn.finance [YFI]:-
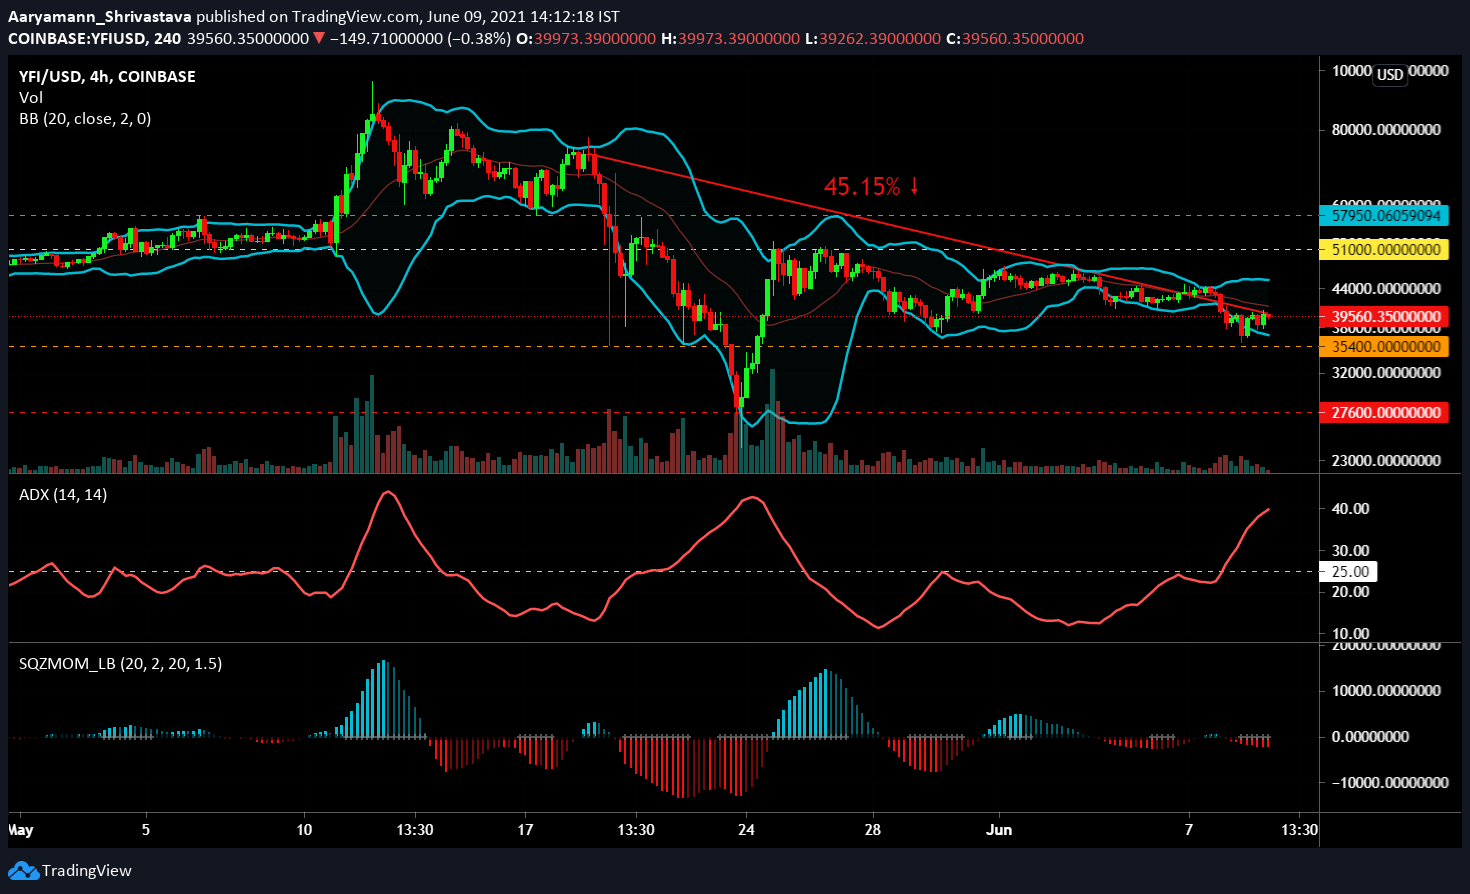
Post the May 19 dip, YFI’s prices experienced a 45.15% drop and brought the coin to $39,560 as observed at press time. Despite being close to breaching past resistance level towards the end of May, the coin had come close to its $35,400 support level 24 hours ago. According to Squeeze Momentum Indicator, YFI was actively in a ‘squeeze release’ ( presence of white dots ) and the visible red bars indicated that bearish pressure was present.
Bollinger Bands indicated the presence of volatility as the bands remained diverged on the 4-hour chart. Average Directional Index (ADX) displayed a highly directional movement as the indicator remained at 39.8, way above the neutral mark. Based on the recent occurrences, every time ADX rose, the price fell. Thus, it would be smart to watch YFI’s movement for the next few hours before making any decision.
Even though it isn’t definite, there is a possibility that the coin would drop below the support level.