MELANIA: Mapping the memecoin’s short term price targets
The OBV has trended higher and formed higher lows over the past 24 hours, and with MELANIA just below the range highs, a breakout was possible.

- The launch of MELANIA came alongside a sharp market-wide sell-off.
- MELANIA appeared to absorb altcoins’ liquidity, but the meme has been in a downtrend since then.
The Official Melania Meme [MELANIA] was launched on the 19th of January, on the eve of Donald Trump’s Presidential Inauguration, a day after the launch of the Official Trump [TRUMP] memecoin.
The launch of MELANIA came alongside high volatility for the rest of the market.

The altcoin market cap excluding Ethereum’s [ETH] was shown above. It had been within a range since late November, and broke below it during Monday’s selling.
The 6.11% altcoin market cap drop on the 19th of January also saw a Bitcoin [BTC] rejection from $106k, with BTC reaching as low as $99.7k before bounding higher to $109.5k the very next day.
MELANIA meme continues to crater-is there hope for recovery?
Since reaching the dizzying heights of $13.63 on the 20th of January, MELANIA is down 87.6%.
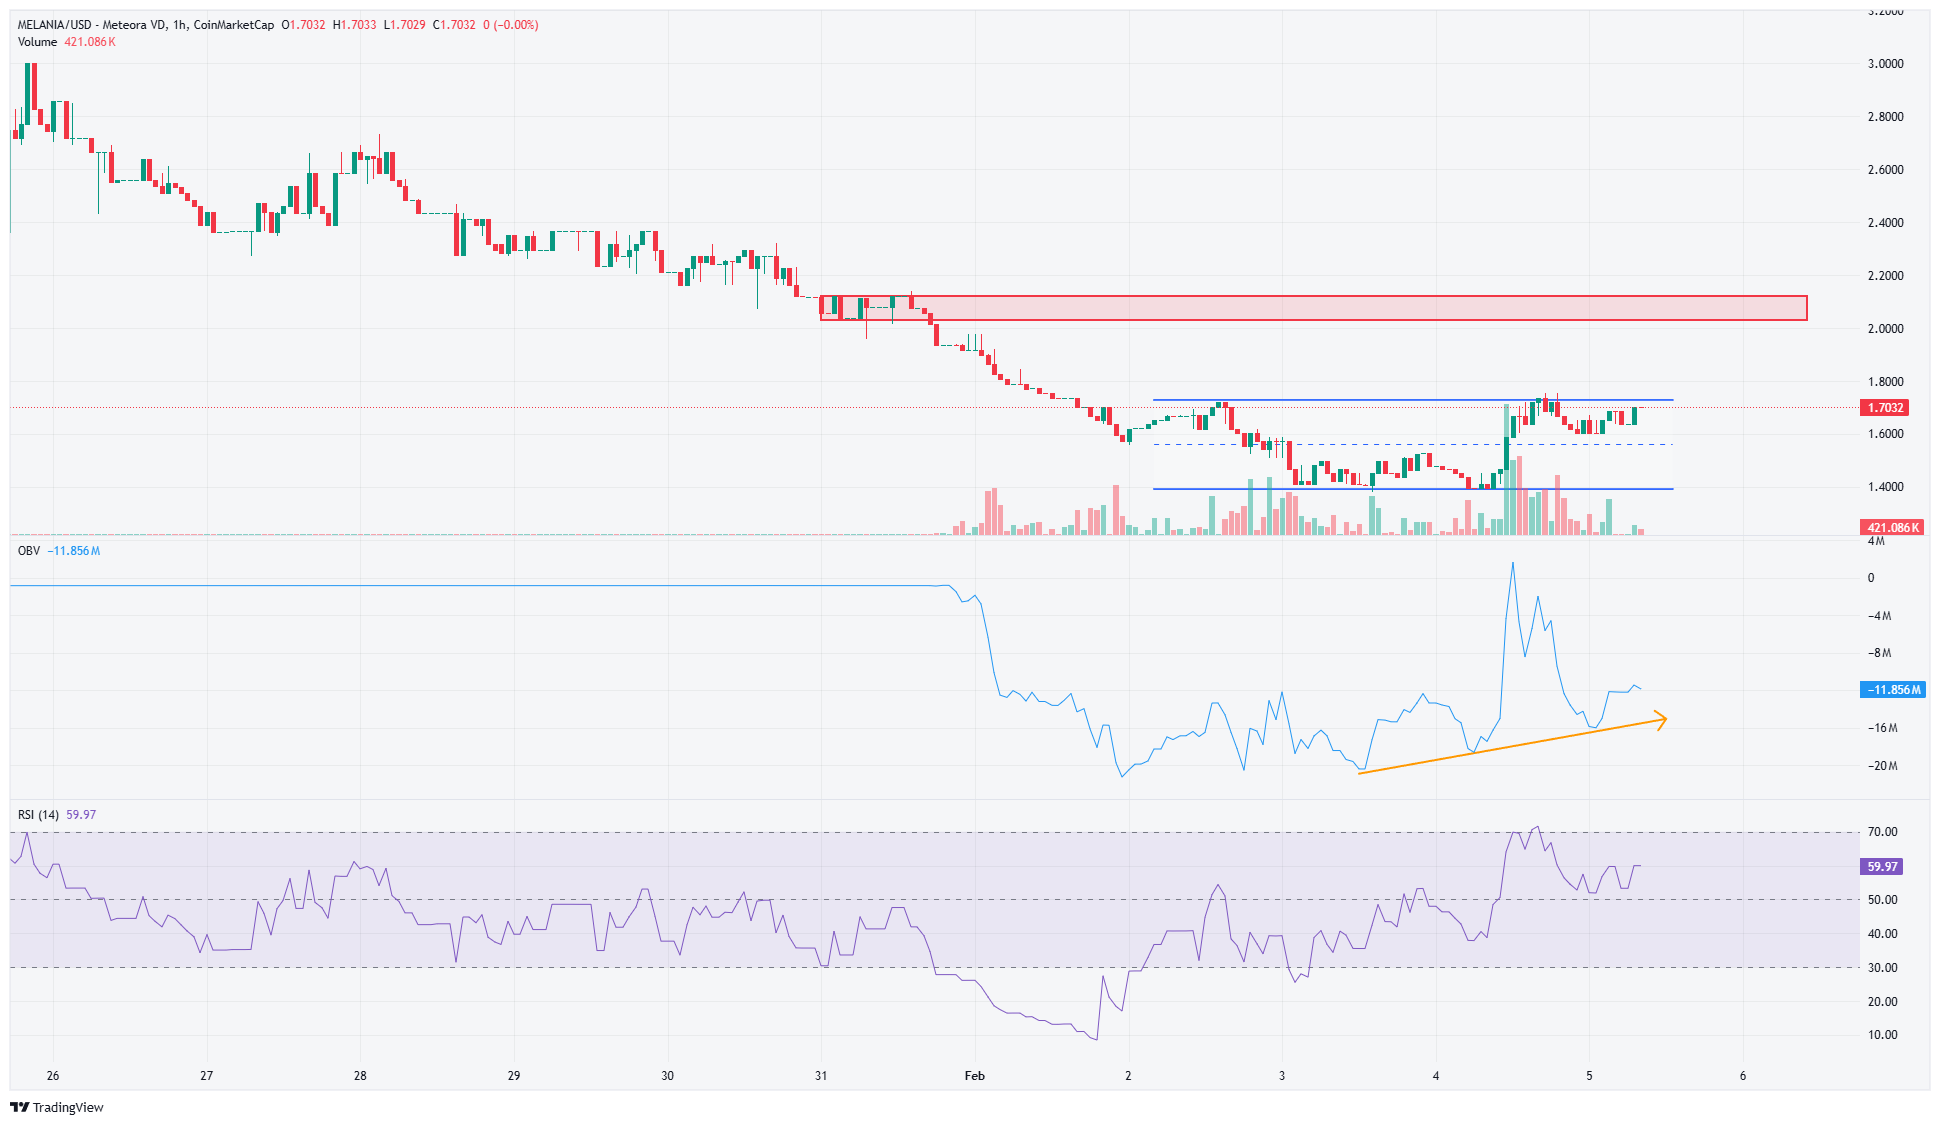
The 1-hour chart showed a range formation over the past three days (purple) that reached from $1.395 to $1.73, at press time.
The meme was trading within the upper half of this range, and its short-term technical indicators showed some bullish promise. The OBV has trended higher and formed higher lows over the past 24 hours.
Realistic or not, here’s MELANIA’s market cap in BTC’s terms
The RSI also recovered and pushed above neutral 50 on the hourly chart. Together, they showed upward momentum was strong in the near term.
This could be enough to break the range highs and drive prices to the next supply zone at $2-$2.1, which was a psychological as well as technical resistance.
Disclaimer: The information presented does not constitute financial, investment, trading, or other types of advice and is solely the writer’s opinion


