
- While the token appears positioned for further gains, technical indicators suggest a potential minor pullback.
- Market metrics present a mixed outlook on FLOKI’s price direction, reflecting uncertainty among traders.
A renewed interest in Floki [FLOKI] has sparked a 7.46% increase in trading activity over the past 24 hours, pushing the memecoin’s price to $0.0001488.
The key question now: Can this rally sustain itself and drive FLOKI to new highs? Or will a short-term dip precede a stronger push upward? AMBCrypto’s analysis examines these possibilities and more as traders watch for the next move.
FLOKI’s chart analysis: Bullish, but key resistance in play
FLOKI remains bullish on the 4-hour chart, but if it fails to hold above the key resistance level of $0.00014572 and trends downward, it could drop to the support at $0.00013981.
From this support, FLOKI is expected to resume its upward trend, targeting the first major level at $0.00016339. However, if the current momentum persists, the token could rally to this target without experiencing the anticipated pullback.
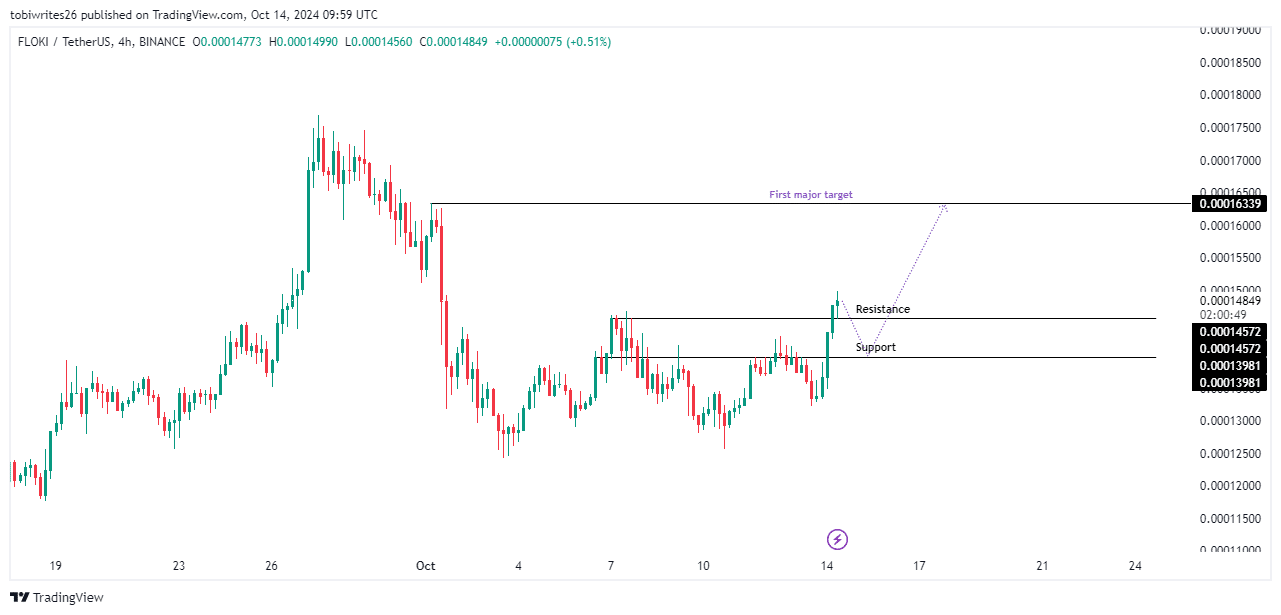
Source: Trading View
To gauge FLOKI’s next move and assess market sentiment, AMBCrypto analyzed key technical indicators.
Bullish narrative holds strong for FLOKI
Technical indicators suggest that FLOKI’s bullish momentum remains intact, with the asset likely to continue its upward trajectory.
The Parabolic SAR (Stop and Reverse) signals that the bullish momentum is strong, indicating that a drop to the highlighted support level may not occur soon.
The role of the Parabolic SAR is to help traders identify price direction and potential reversals—dots below the price indicate an uptrend, while dots above suggest a downtrend.
Similarly, the Relative Strength Index (RSI) continues its climb toward the overbought region above 70. If this level is reached, FLOKI could face a pullback. However, for now, the asset remains firmly bullish.
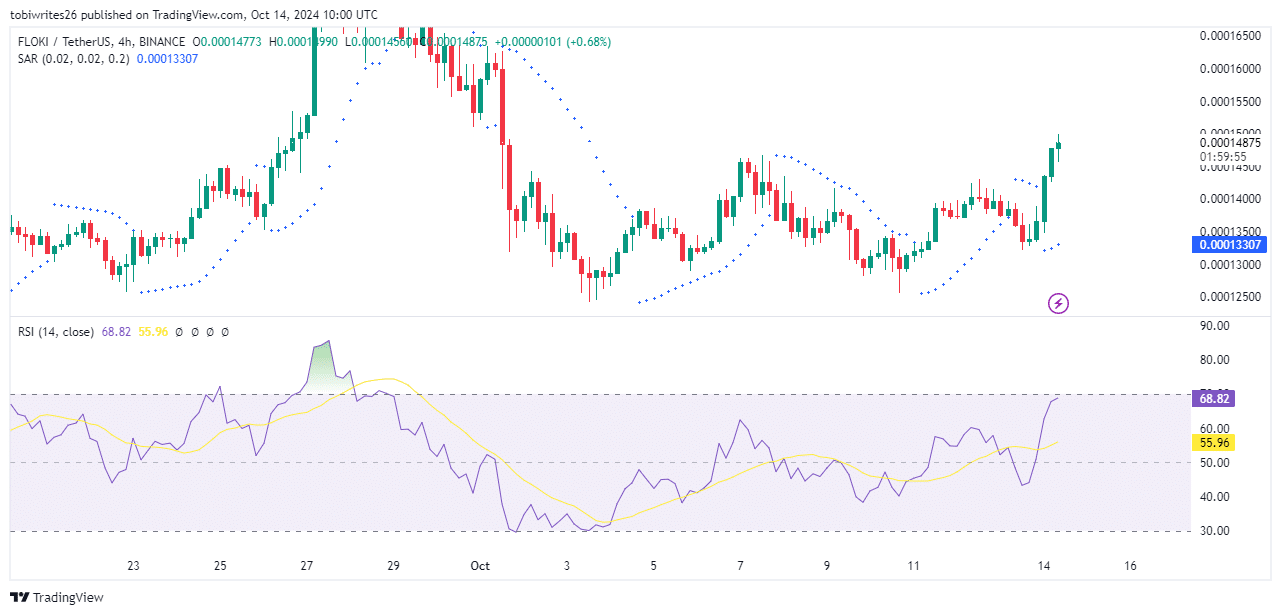
Source: Trading View
On-chain metrics, however, show that market participants are cautious, with some hesitation to fully commit to the rally, signaling a possible short-term dip.
Rally lacks full support
Traders are hesitant to back FLOKI’s recent rally, as both Open Interest and liquidation data indicate bearish sentiment still prevails.
Open Interest, which measures market sentiment by tracking the balance of long and short positions, continues to trend downward, reflecting a bearish market.
Despite a 15% price increase over the last 24 hours, this surge has yet to influence the chart significantly, suggesting that bears remain in control.
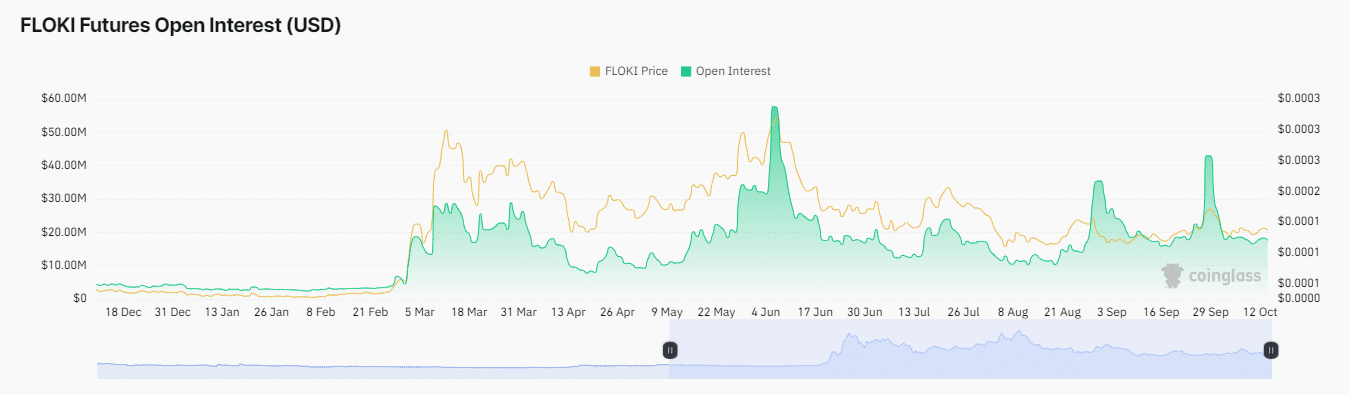
Source: Coinglass
Realistic or not, here’s FLOKI’s market cap in BTC’s terms
Similarly, liquidation data—used to determine market direction by analyzing which side is incurring losses—shows that long traders have lost over $63,000 in the past day.
These indicators suggest that the market remains bearish, and without a notable shift in sentiment or volume, FLOKI is likely to face further declines.