
The global cryptocurrency market saw some selling lately, even though Bitcoin was relatively successful in holding its position on the charts. Alas, the king coin’s retracement towards $35,000 over the last 24 hours triggered a sharper sell-off and most alts were under the pump at press time. The likes of Monero, MATIC, and VeChain moved south and remained vulnerable to additional losses.
Monero [XMR]
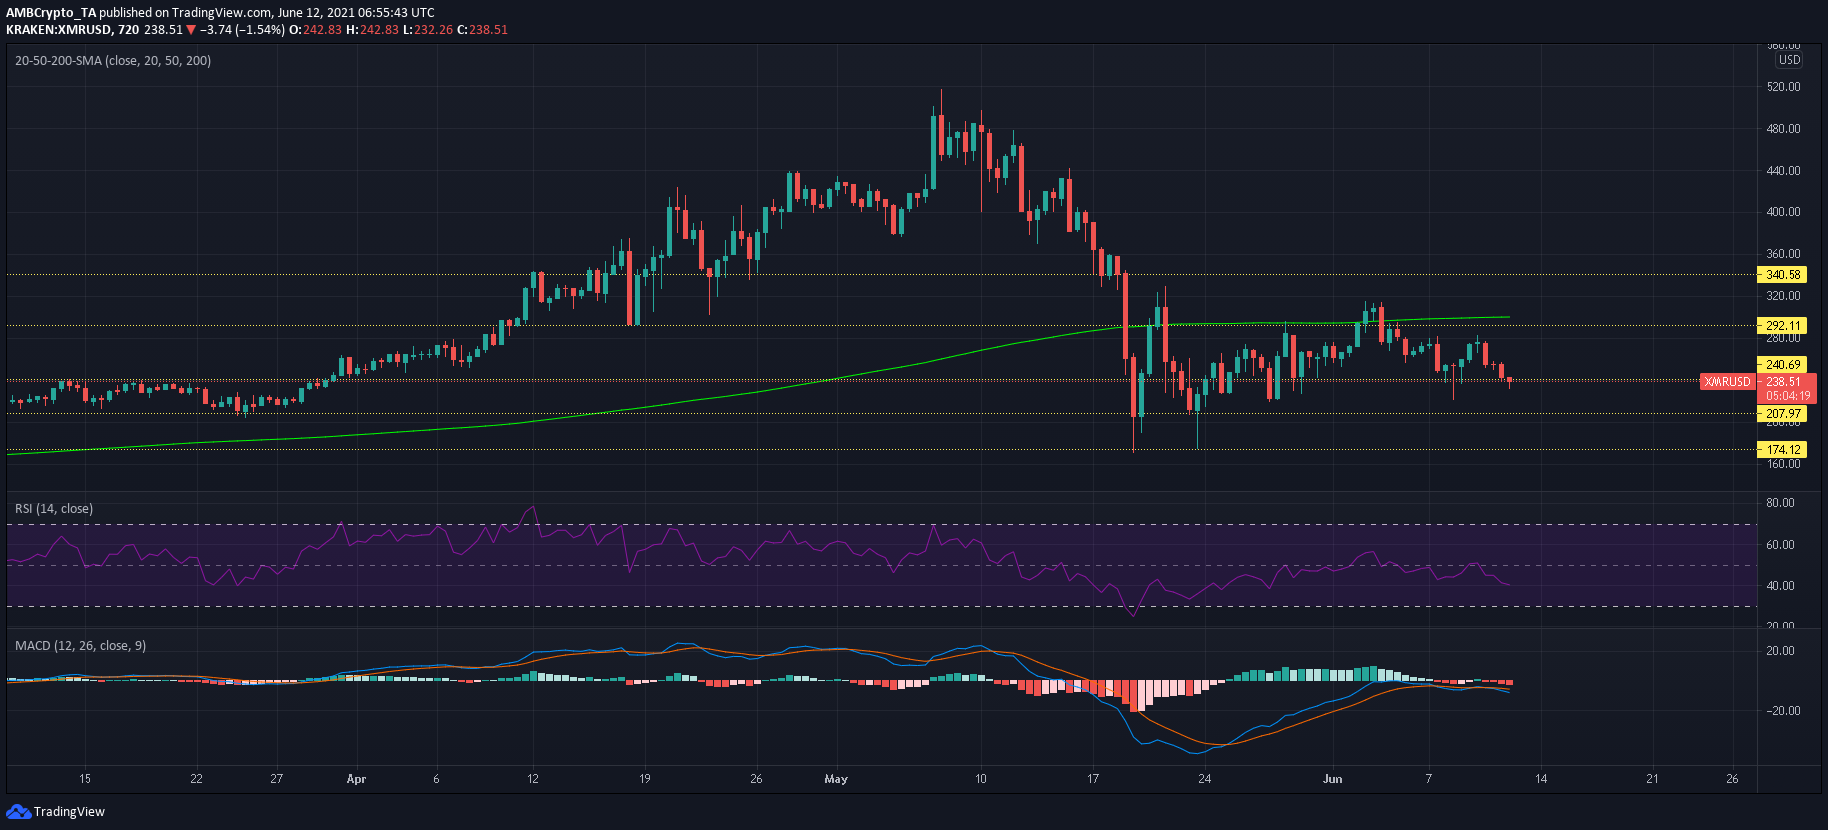
Source: XMR/USD, TradingView
A look at Monero’s 12-hour chart showed that after the price was denied a break above the $292-resistance and the 200-SMA (green), the last four sessions resulted in red candlesticks. A close below the $240-support meant that XMR remained exposed to further losses.
The RSI’s downtrend confirmed XMR’s price action as sellers mostly controlled the market since XMR formed a top at $315 during the first week of June. The MACD line was below the fast-moving line and supported the RSI’s bearish stance. Moving forward, bulls would hope to cut incoming losses at the demand zone of $174-208.
MATIC
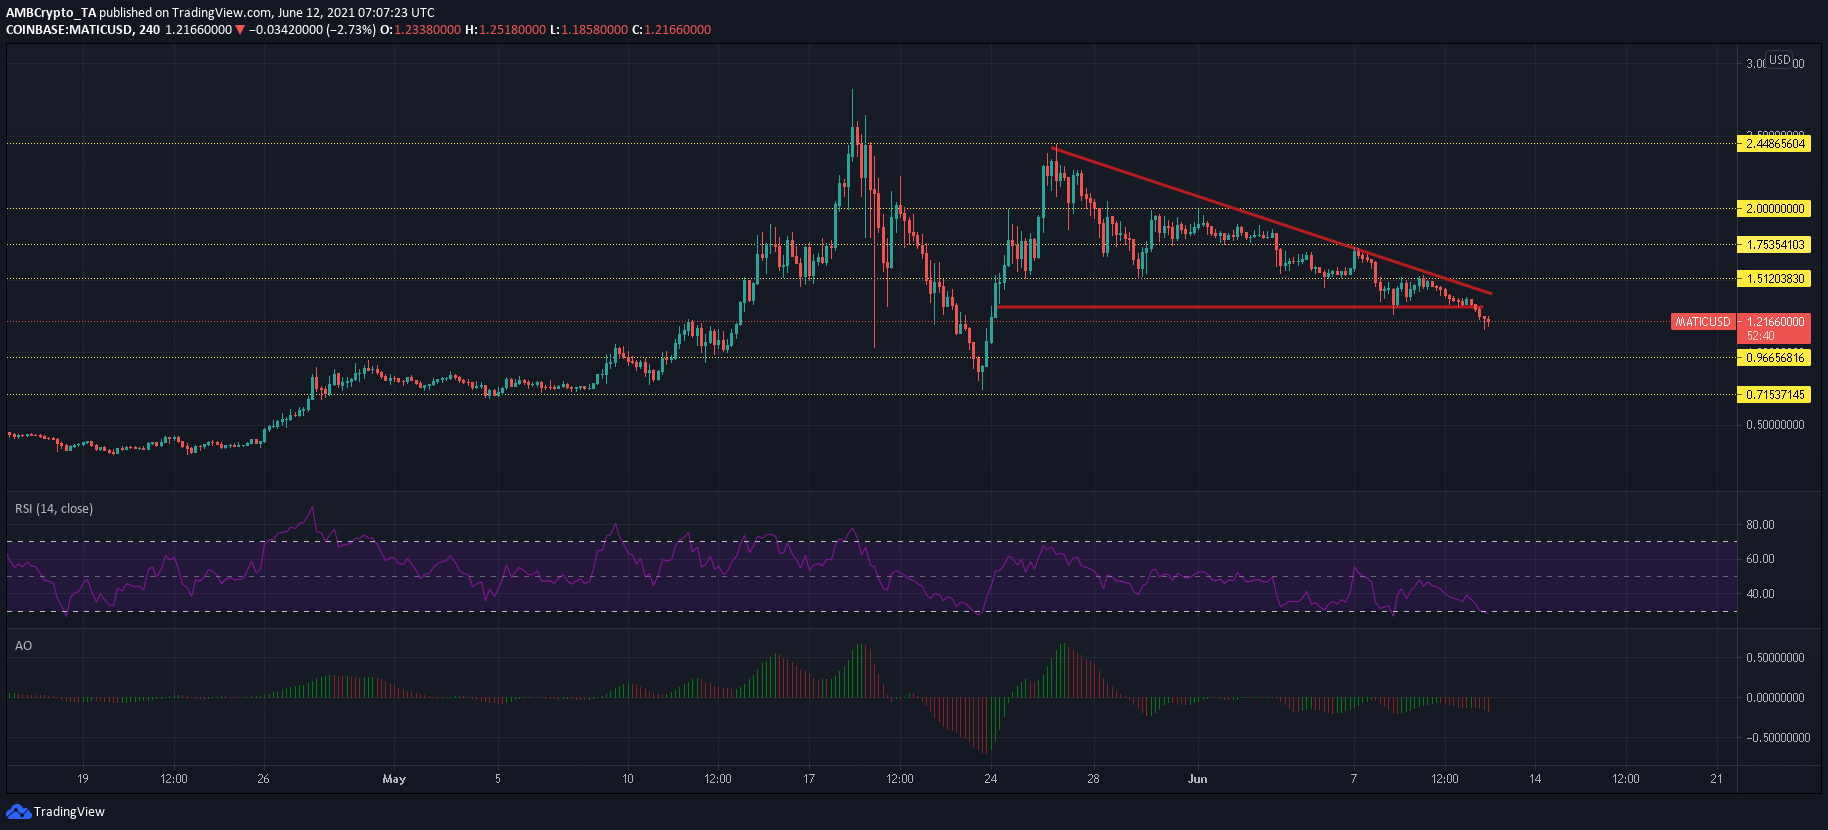
Source: MATIC/USD, TradingView
MATIC’s movement within a bearish setup – a descending triangle – flashed some warning signs prior to today’s breakdown. Hence, it was no surprise when MATIC bulls ceded the bottom trendline to the sellers. A breakdown represented losses of 10% and an extended sell-off seemed likely as only a few weak support lines lay between MATIC’s descent towards the $1-mark.
Bearish momentum was on the up on the Awesome Oscillator over the past couple of days. Some relief was provided by the RSI’s oversold nature which warranted a reversal. This translated to MATIC finding some support at its present price, but selling pressure would likely drag the cryptocurrency to lower levels after a reset.
VeChain [VET]
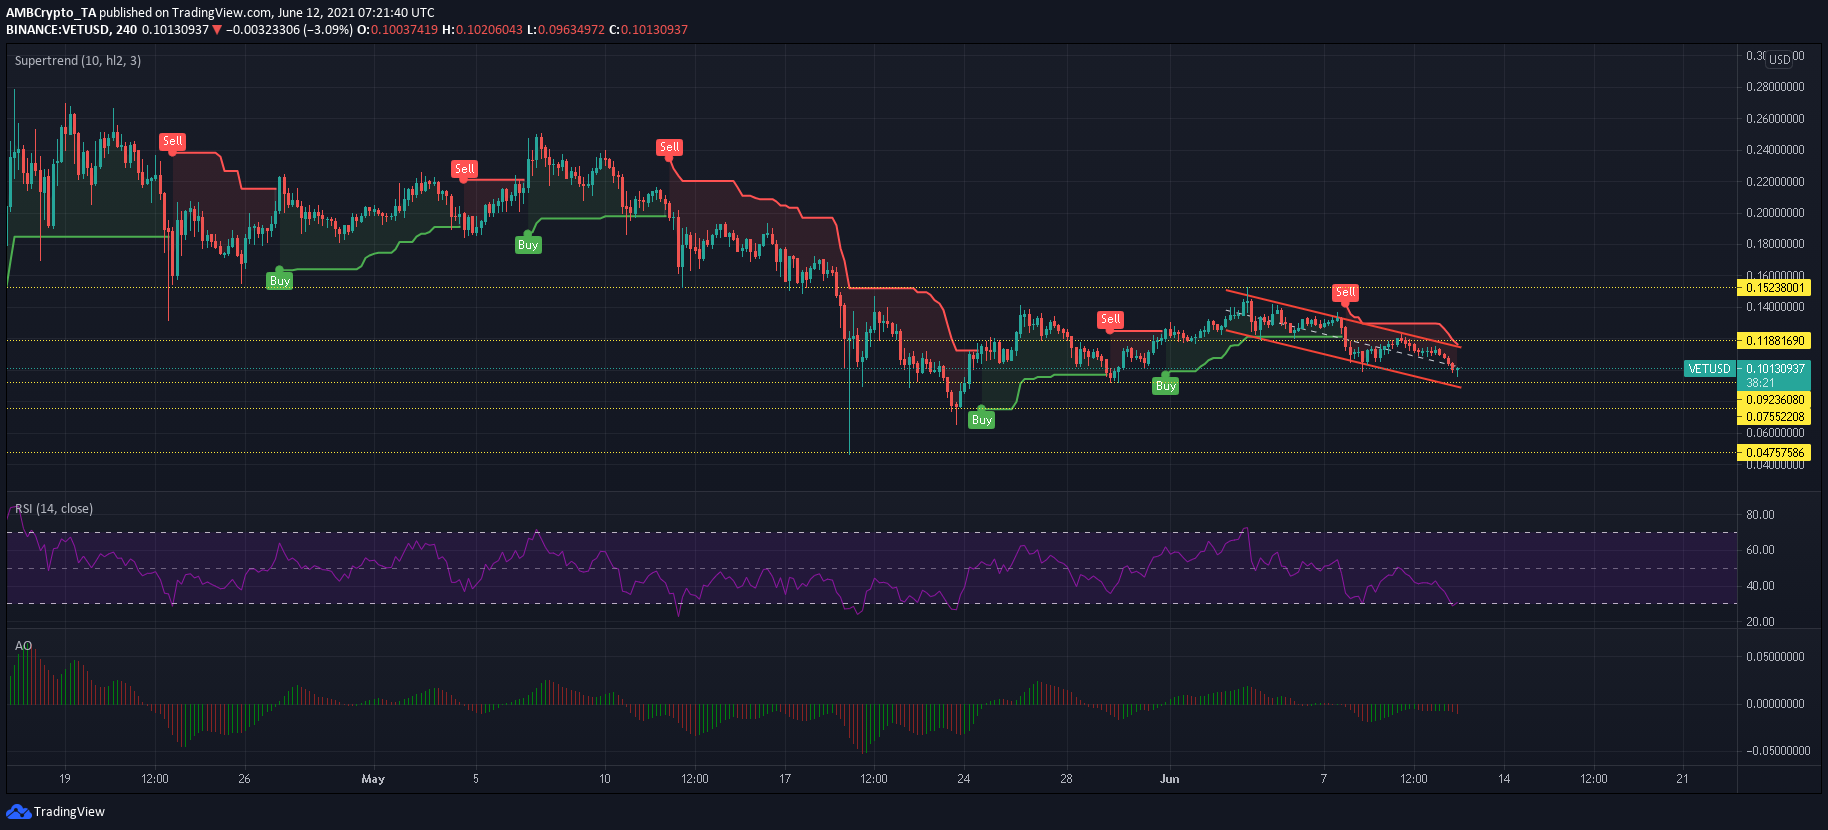
Source: VET/USD, TradingView
Despite losses of 3% over the last 24 hours, VeChain’s down-channel remained intact on its 4-hour chart. In fact, the price approached a crucial area of support at $0.092 and a breakdown could trigger another 20% retracement. However, as was the case with MATIC, VET’s RSI also suggested a reversal since it was trading in the bottom zone.
If the bulls manage to defend $0.092 from a breakdown, VET would likely oscillate within its pattern with a slight chance of breakout above $0.118. The upper trendline of the pattern and $0.118 was further highlighted by the Supertrend Indicator, a level that would switch to buy from sell in case of a move above the aforementioned areas.