Monero, Synthetix, Maker Price Analysis: 14 April

Monero formed yet another symmetrical triangle and a breakout could go as high as $370. Synthetix needed to climb above $22.3 and $24.1 to make a recovery towards its late February levels. Finally, Maker did not look ready to climb above its $3,105-resistance just yet.
Monero [XMR]

Source: XMR/USD, TradingView
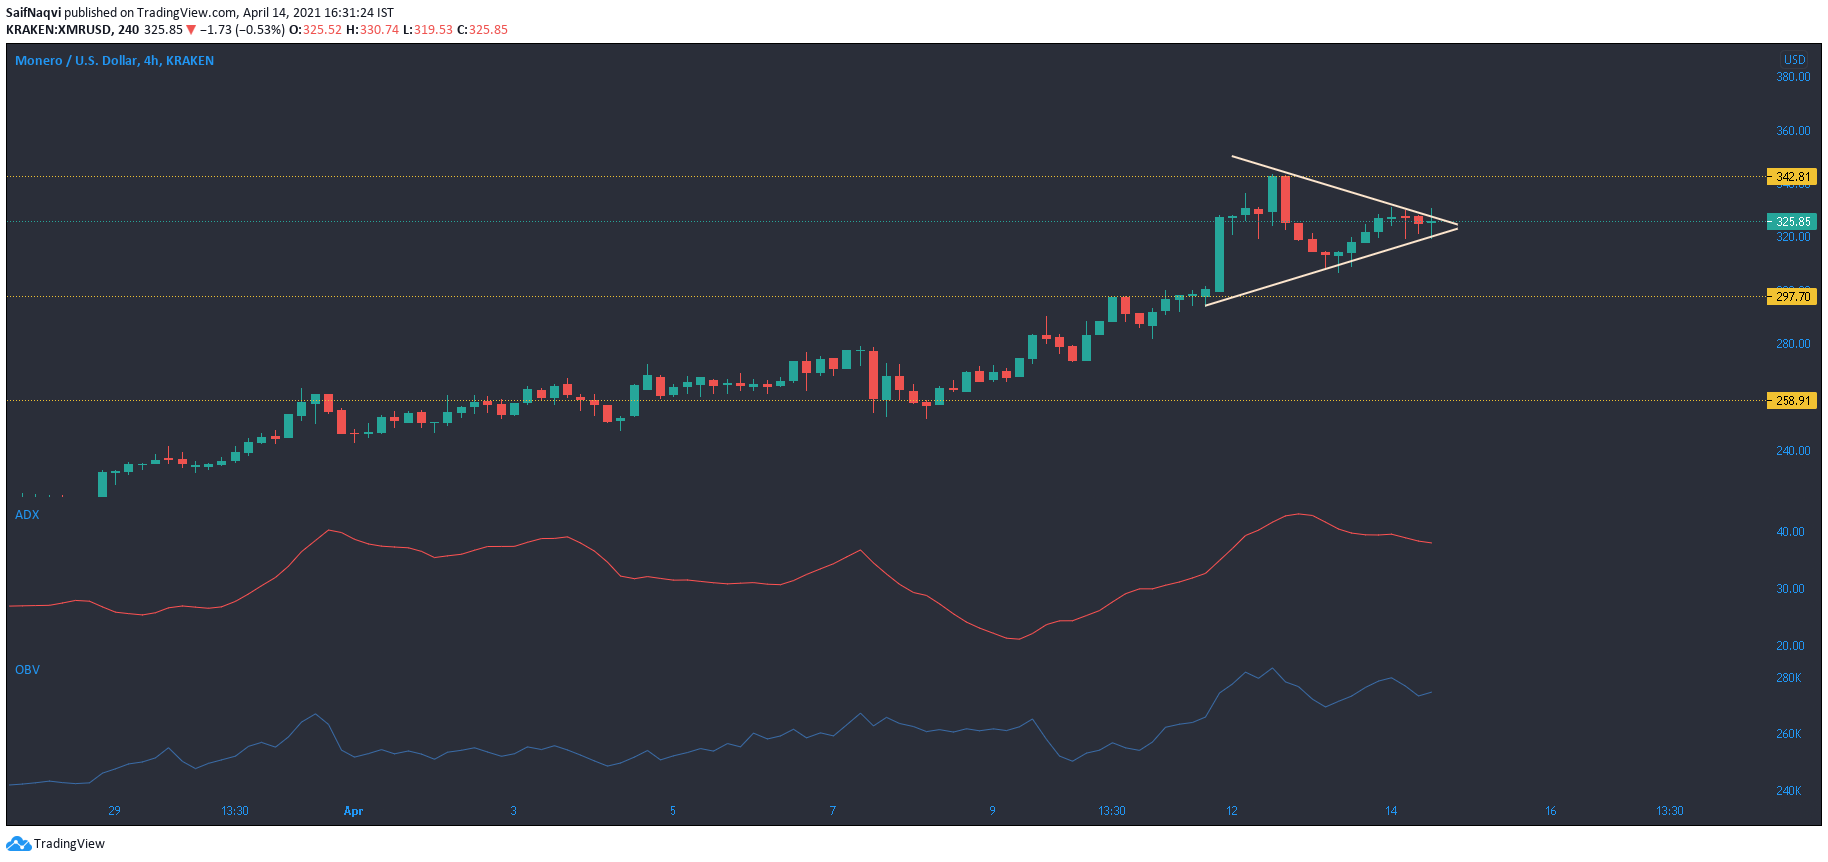
Monero registered a strong upcycle after the price broke north from a major resistance level; at $239.05. In fact, XMR formed a symmetrical triangle prior to the breakout and gains from the upper trendline up to the rally’s peak amounted to over 50% (not shown). Another symmetrical triangle appeared on the 4-hour timeframe after the price made higher lows and lower highs from the $342-level. While a breakout may not peak as high as the last, a bullish outcome can be predicted nevertheless.
An ADX reading of 38 underlined the presence of bullish strength in the market, in case of another price swing. The OBV was trending lower over the past few sessions but showed some buying at the time of writing. A breakout from this pattern could touch $360 or even $370 but the trading volumes were not there yet to support this outcome.
Synthetix [SNX]

Source: SNX/USD, TradingView
While some alts have been peaking during the present rally, Synthetix has been struggling since the broader market pullback in late February. A downwards sloping trendline was finally breached during the first week of April and this was a positive sign for its trajectory for the rest of the month. Key resistance levels lay at $22.3 and $24.1, and these lines must be breached for bullish recovery.
A bearish divergence was spotted on the RSI after SNX got rejected at the upper ceiling of $22.28. The RSI was in neutral territory, at the time of writing. The MACD looked to make a comeback above the half-line, but another dip could take place before SNX’s next upswing.
Maker [MKR]
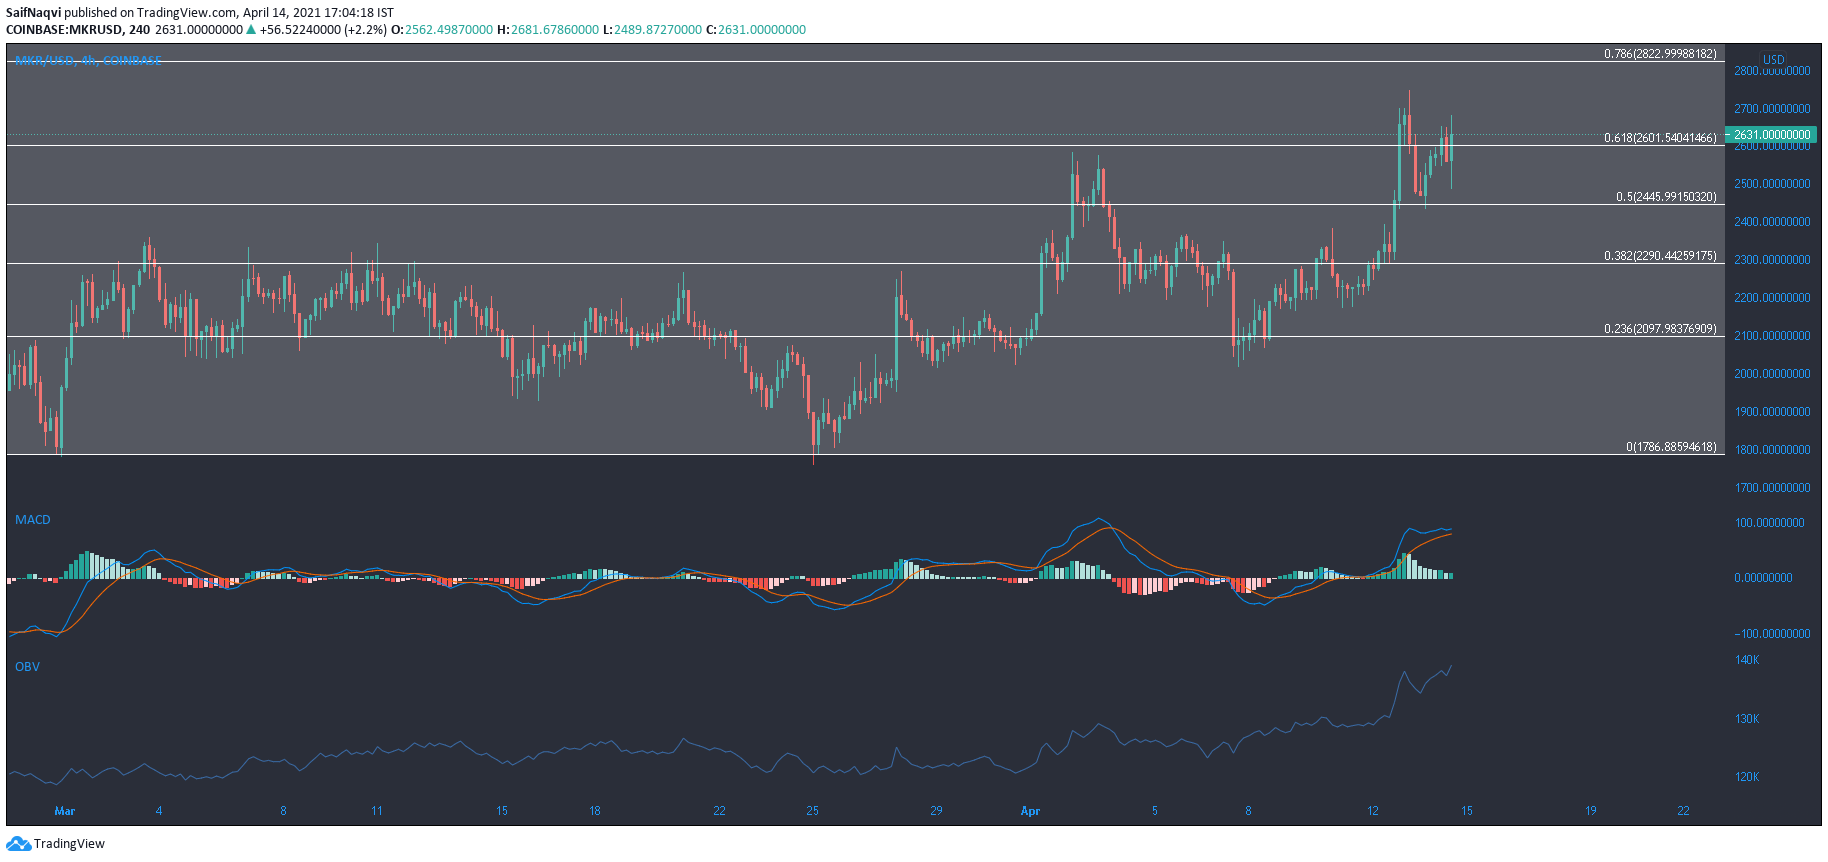
Maker was in the same boat as SNX, but its recovery had already made headway towards its late February levels. On the 4-hour timeframe, the price rose north from the important 50% Fibonacci retracement level, retested this line, and continued its northbound trajectory, at the time of writing.
The OBV was pointing north as buying volumes outmatched selling volume. This was a positive sign as the price approached the 78.6% Fibonacci retracement level. However, the MACD closed in on a bearish crossover, while the histogram noted decreasing momentum. This suggested that the bulls could lose steam before attempting a breakout.
In either case, the market did not seem ready just yet to climb above the $3,105-resistance.


