NEAR may be heading to its 2024 low, despite bullish signs – Why?

- While the asset seemed to be trading within a bullish pattern, it faced significant downward pressure too
- Market participants contributed to this trend by moving NEAR to exchanges
Over the past month, NEAR has struggled, posting a 25% decline on the charts. Over the last 24 hours too, the altcoin lost an additional 2.80% of its value. Despite this bearish momentum, however, emerging bullish patterns suggested that there may be a potential pause in the downtrend.
The pressing question is whether bullish expectations can withstand the ongoing selling pressure from market participants.
NEAR shows bullish potential on the chart
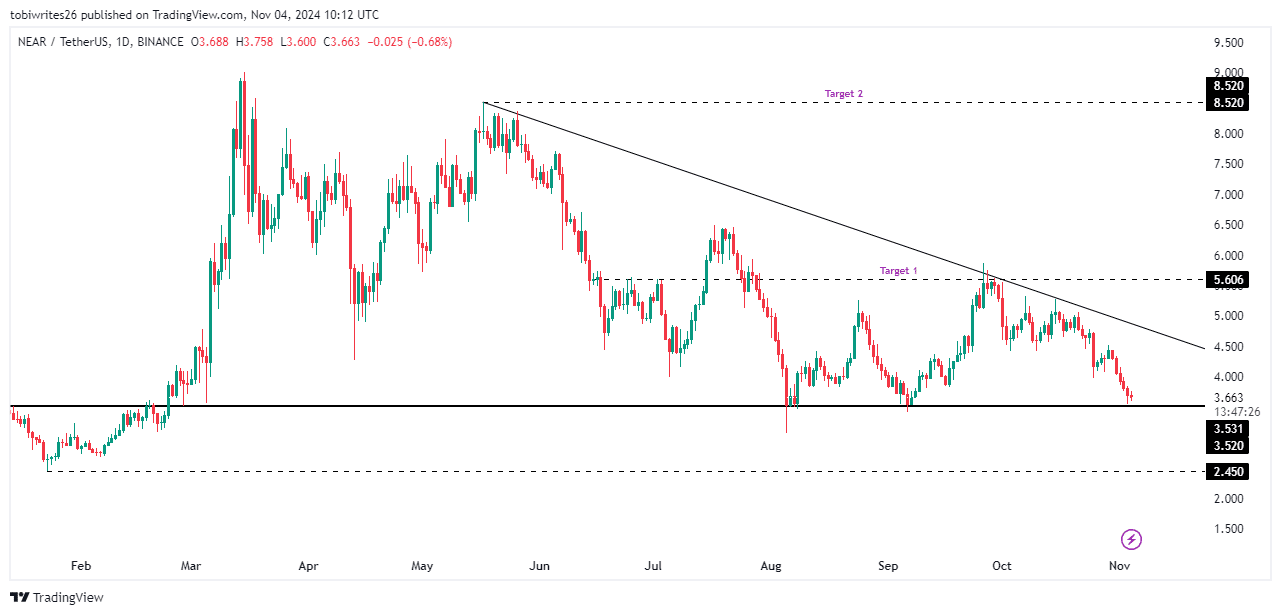
On the daily timeframe, NEAR formed a bullish triangle pattern – A pattern that often indicates an impending rally. This pattern consists of a diagonal resistance line and a horizontal support line.
For NEAR to advance, it needs to test the support level at $3.520. After this test, the asset can either bounce back into the pattern or break out. If a breakout occurs, two key targets might emerge – A short-term level at $5.606 and a long-term target of $8.520.
However, if bearish pressure dominates, NEAR may decline towards its January 2024 low of $2.450, with the risk of further losses.
To forecast NEAR’s next price movements, AMBCrypto analyzed on-chain metrics to share some insights into future trends.
Liquidation data disparity a sign of rising sell pressure on NEAR
Sell pressure on NEAR may be set to climb as key indicators revealed a strong bearish sentiment likely to drive the asset’s price lower.
At the time of writing, NEAR’s liquidation data revealed a sharp imbalance – Over $1.02 million in long liquidations versus just $45.81k in short liquidations. This disparity highlighted a decisively bearish market position, suggesting further downside for the asset.
Liquidation data, which tracks forced closures of leveraged positions when margin requirements aren’t met, reveals market sentiment by showing where losses are concentrated— Currently among long (buy) positions.
Meanwhile, NEAR’s Open Interest, measuring sentiment based on active derivatives contracts, dropped by 1.65% over the last 24 hours to $185.65 million. This lent weight to the altcoin’s bearish outlook.
With both liquidations and Open Interest data pointing to sustained bearish pressure, NEAR’s anticipated bullish support may fail to hold.
Bearish trend persists as key indicators confirm downside
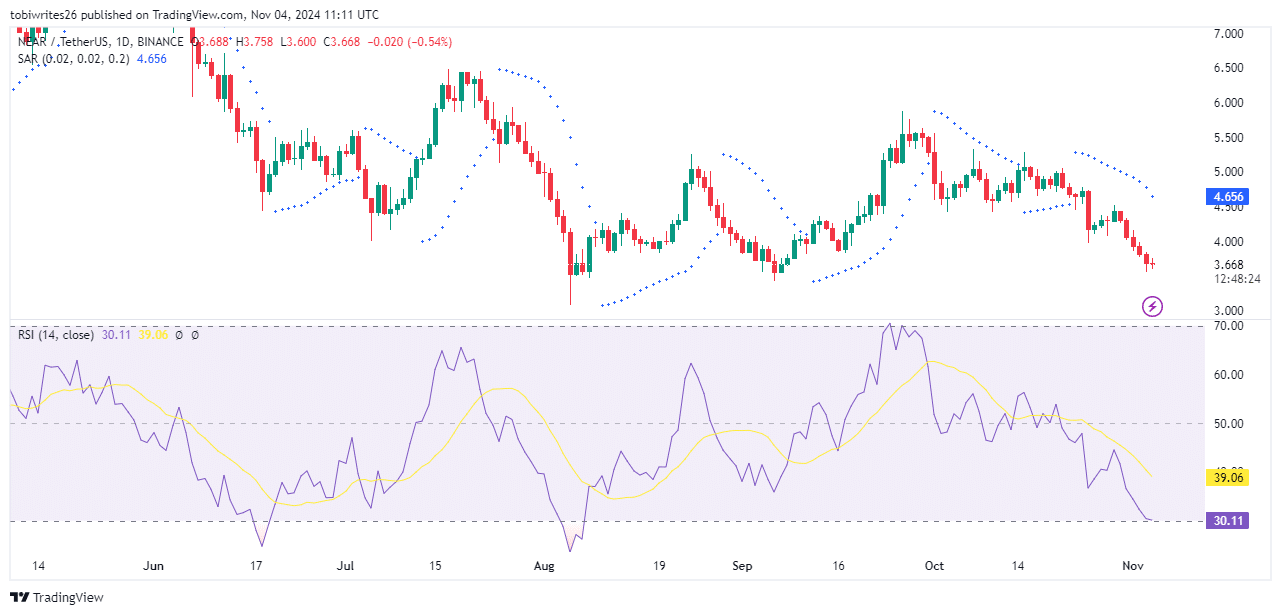
At press time, the prevailing trend for NEAR remained bearish, as confirmed by key technical indicators. In fact, both the Relative Strength Index (RSI) and Parabolic SAR signaled a sustained downside.
The RSI had a bearish reading of 30.69. If it falls below the critical 30-mark, it could mean more downside for NEAR.
Similarly, the Parabolic SAR’s dotted markers were position well above the price candles – Another bearish sign.
With both on-chain metrics and technical indicators flashing bearish signs, a lower target of $2.45 might be increasingly likely.


