NEAR Protocol predictions backfire as prices slide 20% in 3 days – What now?

- NEAR maintained its higher timeframe bullish bias after the remarkable rally in December.
- A fall below $3.8 could take the token to $3, especially if BTC falls below $42k.
Near Protocol [NEAR] saw its token skyrocket in value in the past two months, gaining 300% from 20th October to 26th December. Since then, the prices have dropped a little. However, the higher timeframe bullish bias remained.
The selling pressure has not been intense and the pullback could be part of a healthy uptrend before the next move higher. Some support zones for NEAR buyers to watch were highlighted.
The 50% retracement level could keep the bears at bay
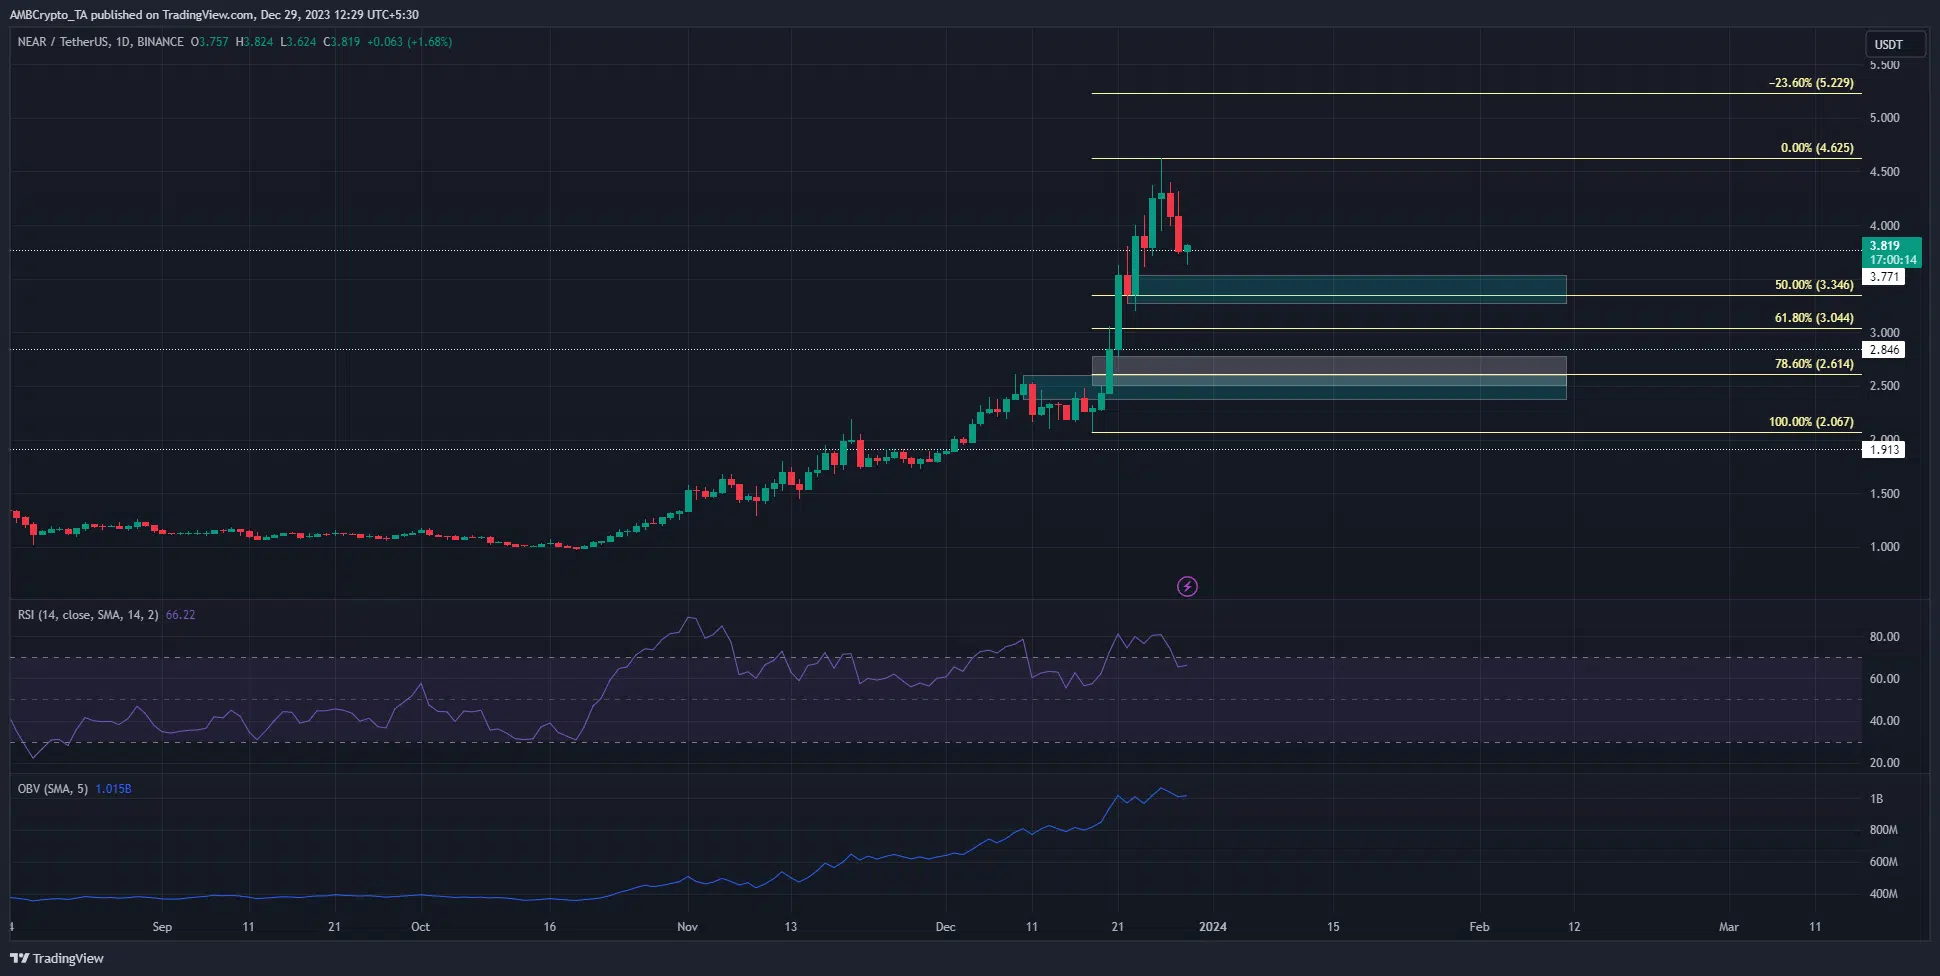
The token has rallied 86% in 11 days. As such, the daily chart was surely bullishly biased. The RSI was above neutral 50 to reinforce the idea that upward momentum was dominant.
Moreover, the OBV has also continued to trend higher. The pullback of the past three days did not dent its advance.
This meant that selling pressure was weak and NEAR would be ready to rally once it retests key support levels. The Fibonacci retracement levels (pale yellow) at $3.34, $3.04, and $2.61 were the levels to watch out for.
The $3.34 level has a lower timeframe consolidation zone nearby, marked in cyan. The $3 is at a psychological support level, and the$2.61 level is in the middle of a fair value gap (white).
It also sat above a bullish breaker block, distinguishing it as the strongest of the three support levels.
The first Fib level could repel the sellers

Source: Hyblock
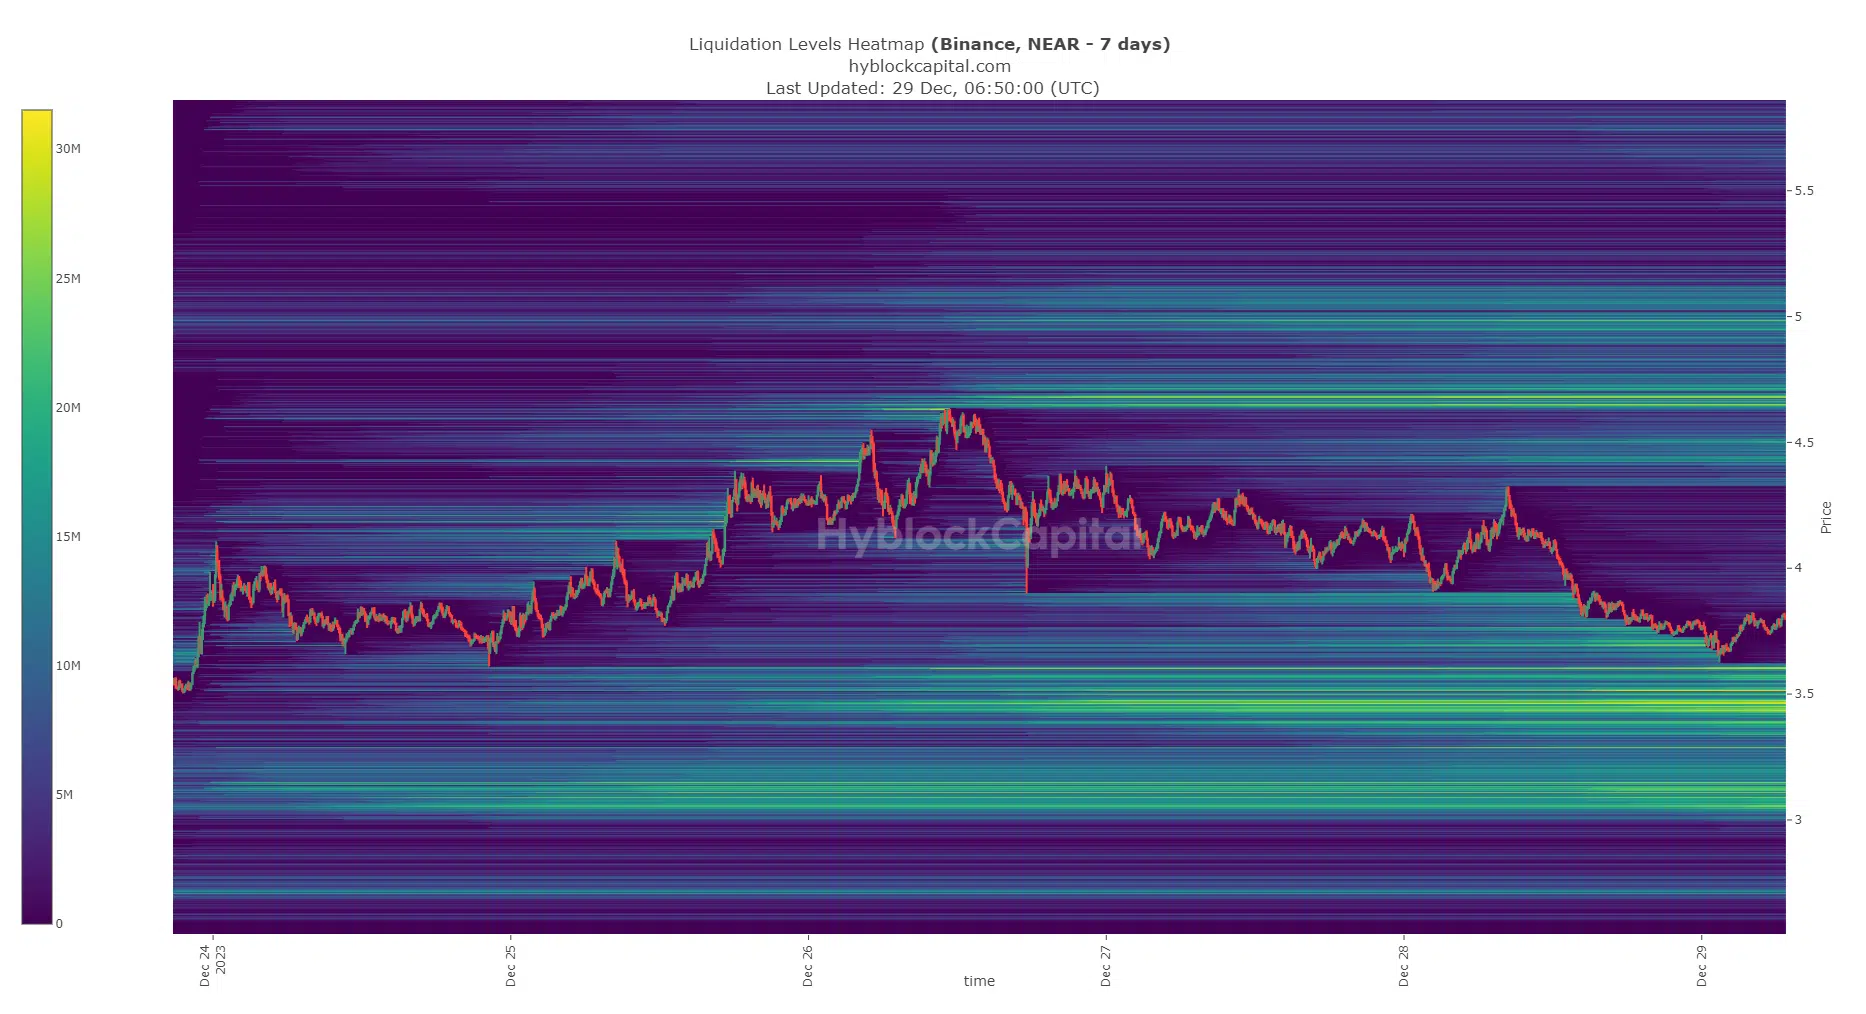
AMBCrypto looked at the liquidation heatmap to aid the analysis of the price charts. The 7-day lookback heatmap from Hyblock gave AMBCrypto some insight into where NEAR could be headed next.
Read Near Protocol’s [NEAR] Price Prediction 2023-24
To the south, the $3.4-$3.52 area represented a large pocket of liquidity. A sweep of this area could yield a bounce.
Alternatively, if Bitcoin [BTC] falls below $42k, it is possible that NEAR could drop further to reach the $3 region.
Disclaimer: The information presented does not constitute financial, investment, trading, or other types of advice and is solely the writer’s opinion.


