NEAR rally in question: Technical indicators show diverging paths

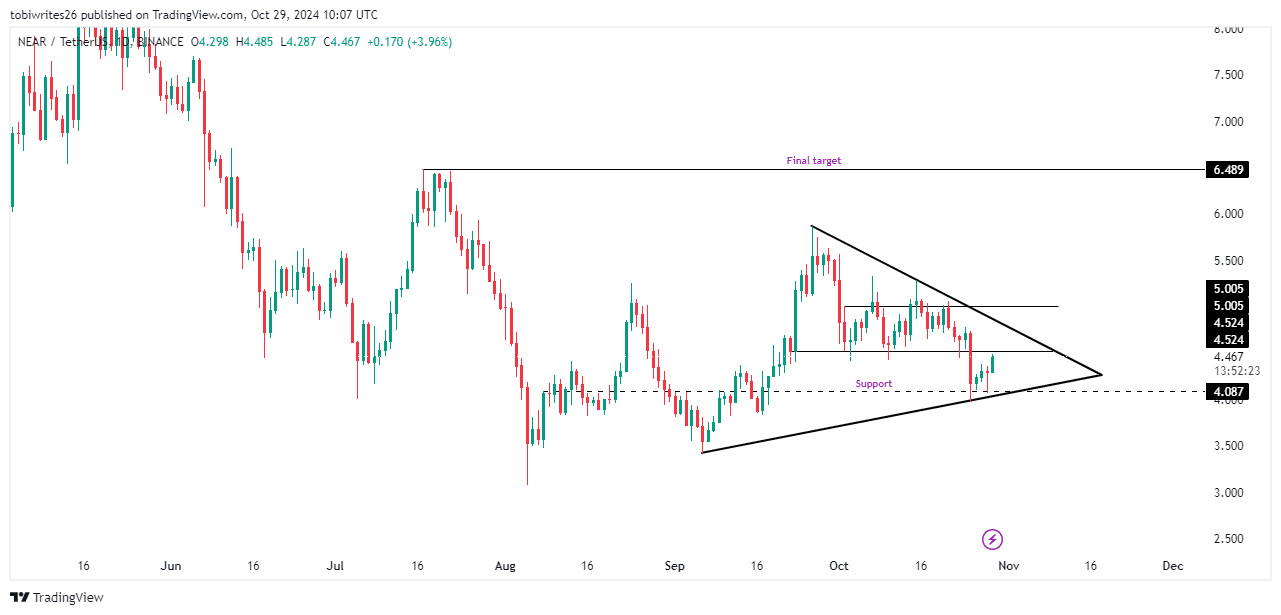
- The token has recently entered a bullish pattern known as a symmetrical triangle, often a precursor to a potential rally.
- However, market sentiment is mixed, with technical and on-chain indicators failing to align.
Over the past month, Near Protocol [NEAR] has struggled, posting a substantial 17.85% loss, which has also impacted its weekly performance with a 4.83% drop—reflecting a prevailing lack of market interest.
Despite these challenges, optimism is beginning to build. NEAR recorded an impressive 5.83% gain in the last 24 hours. The key question now: will this momentum endure and shift sentiment from bearish to bullish?
Rally ready, but obstacles await
NEAR has made a strong upward move, initially bouncing off the ascending triangle support zone and a horizontal support line at $4.087. This rebound has significantly influenced its daily gains and aligns with the overall bullish pattern of a symmetrical triangle.
However, NEAR’s rally faces major obstacles within key resistance zones that could trigger a decline. The first resistance level is at $4.524, followed by another at $5.005.
If NEAR can surpass both levels, it could enter a bullish phase, potentially reaching $6.40, where profit-taking activity from traders is likely to occur. If not, it will continue trading within the symmetrical triangle.
Uncertainty among market participants
NEAR’s potential rally is now threatened by the uncertainty that permeates the market, as technical indicators provide conflicting signals.
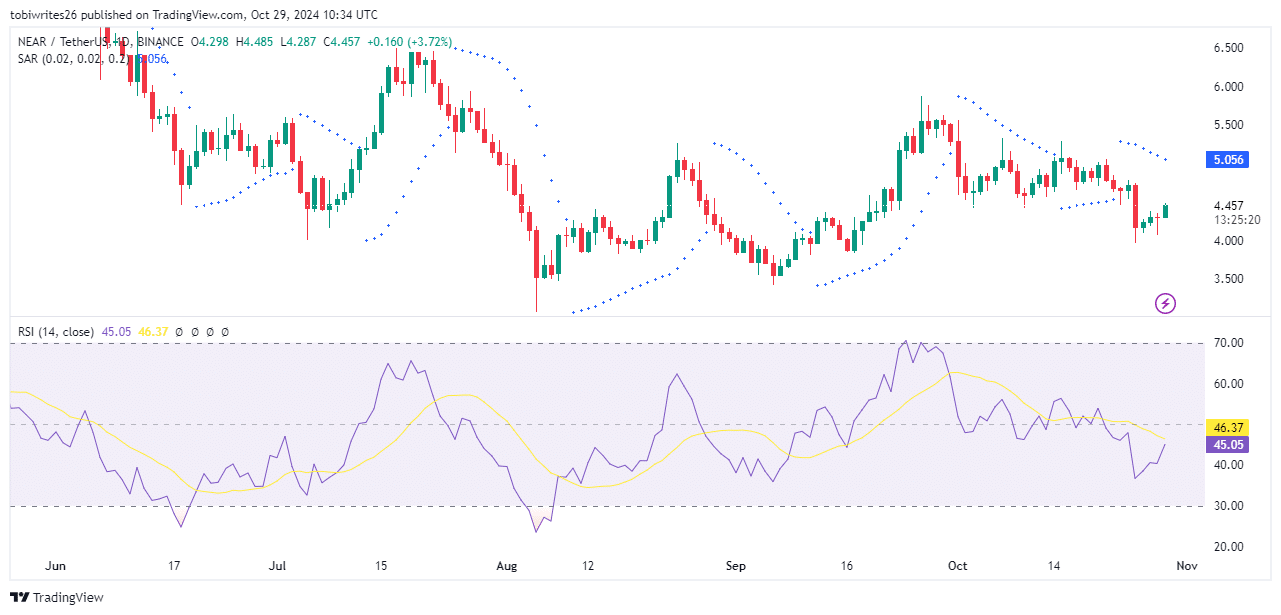
The Parabolic SAR (Stop and Reverse) is a trend-following indicator that helps identify the direction of an asset’s price and potential reversal points. When the SAR dots are below the price, it indicates an uptrend; when they are above, it signals a downtrend.
Currently, NEAR’s SAR dots are positioned above the price, suggesting underlying bearish sentiment that may hinder the asset’s upward momentum or force it downward.
Conversely, the Relative Strength Index (RSI) has shown a major upswing and is currently trending higher, with a reading of 45.03. If this momentum continues and the asset crosses into bullish territory, NEAR could see further upside.
With these conflicting signals, the directional bias among traders regarding NEAR’s next move remains uncertain.
Read NEAR Protocol’s [NEAR] Price Prediction 2024–2025
Open interest is bullish
According to Coinglass, the Open Interest for NEAR is currently bullish, reflecting positive market movement. In the last 24 hours, it has increased by 5.19%, bringing its total value to $212.45 million.
This indicates that more long positions are being opened than short positions, which could positively influence the price trend if this momentum continues.


